Dates: 2/19/20 - 2/29/20
Region: SOP
Led by: Amy Lee
Surveyors: Amy Lee, Chuck Curry, Eric A. Frick, Fred Hartner, Janet Camp, Janet Eyre, Kara Toole, Laura Hartner, Lillian Kenney and Sue Manning
Total Surveys: 211
#Species Reported: 616
Survey Type: SA = Species & Abundance; SO = Species Only - How to interpret REEF data?
Click a column header to sort by that column. Hold shift and click to sort by multiple columns
| Surveys | Bottom Time | |||||
|---|---|---|---|---|---|---|
| Expert | Novice | |||||
| Code | Name | SA | SO | SA | SO | (H:M) |
| 5 | Fiji | 90 | 0 | 121 | 0 | 239:22 |
| 5101 | Viti Levu | 4 | 0 | 7 | 0 | 10:14 |
| 51010002 | Samu Reef (Lautoka - NAI'A Checkout Site) | 4 | 0 | 7 | 0 | 10:14 |
| 5102 | Bligh Water | 47 | 0 | 63 | 0 | 128:26 |
| 510201 | Vatu-i-ra Barrier Reef and Makongi Channel | 47 | 0 | 63 | 0 | 128:26 |
| 51020101 | Cat's Meow | 4 | 0 | 5 | 0 | 9:54 |
| 51020102 | Humann Nature (Bligh Water) | 4 | 0 | 3 | 0 | 8:23 |
| 51020103 | UndeNAIAble Reef / Wall | 2 | 0 | 3 | 0 | 6:43 |
| 51020104 | E-6 / Cathedrals / North Wall | 4 | 0 | 5 | 0 | 10:51 |
| 51020105 | Mt. Mutiny / Hi-8 | 4 | 0 | 4 | 0 | 10:45 |
| 51020113 | Coral Corner / Pure Magic / Instant Replay (Vatu-i-ra) | 4 | 0 | 5 | 0 | 9:23 |
| 51020115 | Mellow Yellow ( Vatu-i-ra ) | 3 | 0 | 2 | 0 | 6:09 |
| 51020119 | Vatu Vai (Wakaya Island) | 3 | 0 | 4 | 0 | 7:54 |
| 51020120 | Wakaya Bay Anchor by Chance (Nai'a Anchorage Wakaya Island) | 0 | 0 | 1 | 0 | 0:56 |
| 51020121 | Whole Shebang (Vatu-i-ra) | 3 | 0 | 5 | 0 | 8:33 |
| 51020123 | Vatu-i-ra Island Site A | 3 | 0 | 4 | 0 | 10:03 |
| 51020132 | Lion's Den (Wakaya Island) | 4 | 0 | 5 | 0 | 10:00 |
| 51020142 | Blue Ridge (Wakaya Island) | 4 | 0 | 5 | 0 | 10:00 |
| 51020144 | Alacrity Wall | 0 | 0 | 1 | 0 | 1:04 |
| 51020156 | UndeNAI'Able Pinnacle | 1 | 0 | 2 | 0 | 3:08 |
| 51020158 | Two Pinnacles (Nananu-i-ra) | 2 | 0 | 4 | 0 | 6:23 |
| 51020159 | Labyrinth (Nananu-i-ra) | 2 | 0 | 5 | 0 | 8:17 |
| 5203 | Namena Marine Reserve and Namenalala Island | 20 | 0 | 24 | 0 | 50:18 |
| 52030002 | Two Thumbs Up (South Save-a-tack) | 2 | 0 | 4 | 0 | 6:35 |
| 52030003 | Tetons I and II (South Save-a-tack) | 7 | 0 | 9 | 0 | 19:59 |
| 52030007 | Kansas (North Save-a-tack) | 4 | 0 | 4 | 0 | 8:37 |
| 52030008 | Grand Central Station (North Save-a-tack) | 4 | 0 | 3 | 0 | 7:47 |
| 52030011 | Namena Bay (Nai'a Anchorage) West | 0 | 0 | 1 | 0 | 0:59 |
| 52030026 | Tetons 3 | 3 | 0 | 3 | 0 | 6:21 |
| 5204 | Other Fiji Islands | 19 | 0 | 27 | 0 | 50:24 |
| 520401 | Gau Island | 19 | 0 | 25 | 0 | 48:02 |
| 52040101 | Jim's Alley (Gau Island) | 2 | 0 | 2 | 0 | 5:00 |
| 52040102 | Nigali Passage (Gau Island) | 8 | 0 | 10 | 0 | 18:21 |
| 52040103 | Anthias Avenue (Gau Island) | 3 | 0 | 6 | 0 | 8:10 |
| 52040108 | Jungle Jig (Gau Island) | 6 | 0 | 7 | 0 | 16:31 |
| 520403 | Kadavu Island | 0 | 0 | 2 | 0 | 2:22 |
| 52040311 | Mellow Yellow (Kadavu Island) | 0 | 0 | 2 | 0 | 2:22 |
| TOTALS | 90 | 0 | 121 | 0 | 239:22 | |
Species
%SF = Sighting Frequency; DEN = Density Score - How to interpret REEF data?
Bar length corresponds to sighting frequency
Color saturation corresponds to density score
Click + to display species image and additional information.
Bar length corresponds to sighting frequency
Color saturation corresponds to density score
Click + to display species image and additional information.
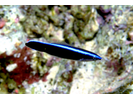
Bluestreak Cleaner Wrasse - Wrasse
(Labroides dimidiatus)
(Labroides dimidiatus)
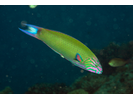
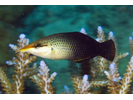
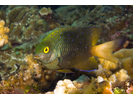
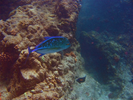
Crescent Wrasse - Wrasse
(Thalassoma lunare)
(Thalassoma lunare)
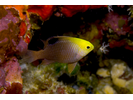
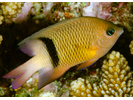
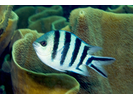
Talbot's Damsel - Damselfish
(Chrysiptera talboti)
(Chrysiptera talboti)
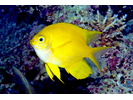
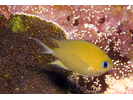
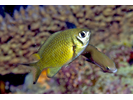
Golden Damsel - Damselfish
(Amblyglyphidodon aureus)
(Amblyglyphidodon aureus)
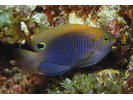
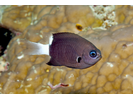
Princess Damsel - Damselfish
(Pomacentrus vaiuli)
(Pomacentrus vaiuli)
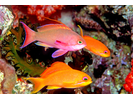
Scalefin Anthias - Grouper
(Pseudanthias squamipinnis)
(Pseudanthias squamipinnis)
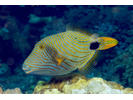
Orange-lined Triggerfish - Triggerfish
(Balistapus undulatus)
(Balistapus undulatus)
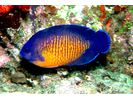
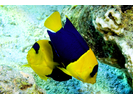
Two-spined Angelfish - Angelfish
(Centropyge bispinosa)
(Centropyge bispinosa)
Bullethead (Pacific) Parrotfish - Parrotfish
(Chlorurus spilurus)
(Chlorurus spilurus)

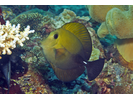
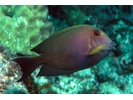
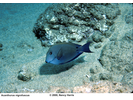
Brushtail Tang - Surgeonfish
(Zebrasoma scopas)
(Zebrasoma scopas)
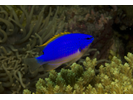
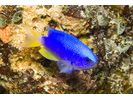
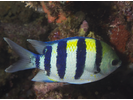
South Seas Devil - Damselfish
(Chrysiptera taupou)
(Chrysiptera taupou)
Blackbar Chromis - Damselfish
(Pycnochromis retrofasciata)
(Pycnochromis retrofasciata)
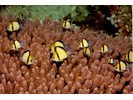
Reticulated Dascyllus - Damselfish
(Dascyllus reticulatus)
(Dascyllus reticulatus)
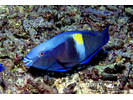
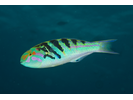
Yellowbar Parrotfish - Parrotfish
(Scarus schlegeli)
(Scarus schlegeli)
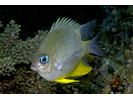
Yelloweye Damsel - Damselfish
(Pomacentrus flavioculus)
(Pomacentrus flavioculus)
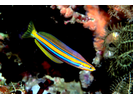
Fiji Fangblenny (Plagiotremus flavus; prev. known as P. oualanensis) - Blenny
(Plagiotremus flavus)
(Plagiotremus flavus)
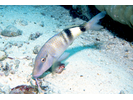
Manybar Goatfish - Goatfish
(Parupeneus multifasciatus)
(Parupeneus multifasciatus)
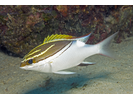
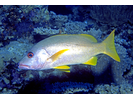
Bridled Monocle Bream - Coral Bream
(Scolopsis bilineata)
(Scolopsis bilineata)
Bicolor Chromis - Damselfish
(Pycnochromis margaritifer)
(Pycnochromis margaritifer)
Three-spot Dascyllus - Damselfish
(Dascyllus trimaculatus)
(Dascyllus trimaculatus)
Lined Bristletooth - Surgeonfish
(Ctenochaetus striatus)
(Ctenochaetus striatus)
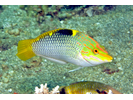
Checkerboard Wrasse - Wrasse
(Halichoeres hortulanus)
(Halichoeres hortulanus)
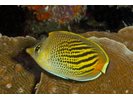
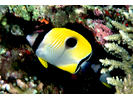
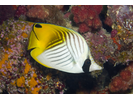
Dot & Dash Butterflyfish - Butterflyfish
(Chaetodon pelewensis)
(Chaetodon pelewensis)
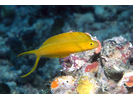
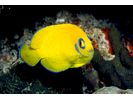
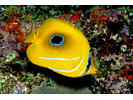
Lemonpeel Angelfish - Angelfish
(Centropyge flavissima)
(Centropyge flavissima)
Vagabond Butterflyfish - Butterflyfish
(Chaetodon vagabundus)
(Chaetodon vagabundus)
Darkfin Chromis - Damselfish
(Pycnochromis atripes)
(Pycnochromis atripes)
Swarthy Parrotfish - Parrotfish
(Scarus niger)
(Scarus niger)
Dotted Fairy Wrasse - Wrasse
(Cirrhilabrus punctatus)
(Cirrhilabrus punctatus)
Blue-Green Damsel - Damselfish
(Pomacentrus callainus)
(Pomacentrus callainus)
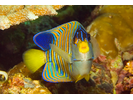
Regal Angelfish - Angelfish
(Pygoplites diacanthus)
(Pygoplites diacanthus)
Bicolor Angelfish - Angelfish
(Centropyge bicolor)
(Centropyge bicolor)
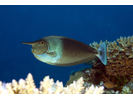
Bignose Unicornfish - Surgeonfish
(Naso vlamingii)
(Naso vlamingii)
Blacklip Butterflyfish - Butterflyfish
(Chaetodon kleinii)
(Chaetodon kleinii)
Ternate Chromis - Damselfish
(Chromis ternatensis)
(Chromis ternatensis)
Bluntheaded Wrasse - Wrasse
(Thalassoma amblycephalum)
(Thalassoma amblycephalum)
Doublespot (pka Twospot) Wrasse - Wrasse
(Halichoeres biocellatus)
(Halichoeres biocellatus)
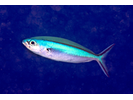
Ruddy Fusilier - Fusilier
(Pterocaesio pisang)
(Pterocaesio pisang)
Cheek-lined (pka Linedcheeked) Wrasse - Wrasse
(Oxycheilinus digrammus)
(Oxycheilinus digrammus)
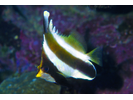
Longfin Bannerfish - Butterflyfish
(Heniochus acuminatus)
(Heniochus acuminatus)
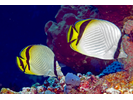
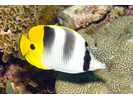
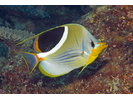
Pacific Double-saddle Butterflyfish - Butterflyfish
(Chaetodon ulietensis)
(Chaetodon ulietensis)
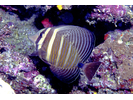
Pacific Sailfin Tang - Surgeonfish
(Zebrasoma velifer)
(Zebrasoma velifer)
Orangespine Unicornfish - Surgeonfish
(Naso lituratus)
(Naso lituratus)
New Guinea Wrasse - Wrasse
(Anampses neoguinaicus)
(Anampses neoguinaicus)
Bird (Pacific) Wrasse - Wrasse
(Gomphosus varius)
(Gomphosus varius)
Blackbar Damsel - Damselfish
(Plectroglyphidodon dickii)
(Plectroglyphidodon dickii)
Eastern Triangular Butterflyfish - Butterflyfish
(Chaetodon baronessa)
(Chaetodon baronessa)

Sixbar Wrasse - Wrasse
(Thalassoma hardwicke)
(Thalassoma hardwicke)
Ambon Chromis - Damselfish
(Pycnochromis amboinensis)
(Pycnochromis amboinensis)
Jewel Damsel - Damselfish
(Stegastes lacrymatus)
(Stegastes lacrymatus)
Barcheek Trevally - Jack
(Carangoides plagiotaenia)
(Carangoides plagiotaenia)
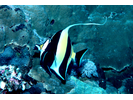
Moorish Idol - Moorish Idol
(Zanclus cornutus)
(Zanclus cornutus)
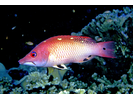
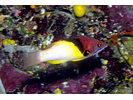
Redfin Hogfish - Wrasse
(Bodianus dictynna)
(Bodianus dictynna)
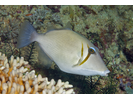
Scythe Triggerfish - Triggerfish
(Sufflamen bursa)
(Sufflamen bursa)
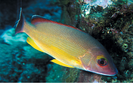
Red Snapper - Snapper
(Lutjanus bohar)
(Lutjanus bohar)
Redfin Bream - Emperor
(Monotaxis heterodon)
(Monotaxis heterodon)

Saddled Butterflyfish - Butterflyfish
(Chaetodon ephippium)
(Chaetodon ephippium)
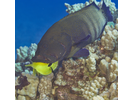
Slingjaw Wrasse - Wrasse
(Epibulus insidiator)
(Epibulus insidiator)
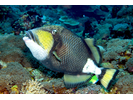
Titan Triggerfish - Triggerfish
(Balistoides viridescens)
(Balistoides viridescens)
Bluestriped Fangblenny - Blenny
(Plagiotremus rhinorhynchos)
(Plagiotremus rhinorhynchos)
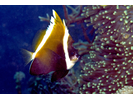
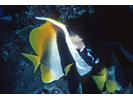
Humphead Bannerfish - Butterflyfish
(Heniochus varius)
(Heniochus varius)
Blackstripe Cardinalfish - Cardinalfish
(Ostorhinchus nigrofasciatus)
(Ostorhinchus nigrofasciatus)
Canary Fangblenny - Blenny
(Meiacanthus oualanensis)
(Meiacanthus oualanensis)
Eclipse Butterflyfish - Butterflyfish
(Chaetodon bennetti)
(Chaetodon bennetti)
Sixstripe Wrasse - Wrasse
(Pseudocheilinus hexataenia)
(Pseudocheilinus hexataenia)

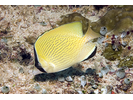
Speckled Butterflyfish - Butterflyfish
(Chaetodon citrinellus)
(Chaetodon citrinellus)
Black-margined Damsel - Damselfish
(Pomacentrus nigromarginatus)
(Pomacentrus nigromarginatus)
Redfin Butterflyfish - Butterflyfish
(Chaetodon lunulatus)
(Chaetodon lunulatus)

Bleeker's Parrotfish - Parrotfish
(Chlorurus bleekeri)
(Chlorurus bleekeri)
Twotone Wrasse - Wrasse
(Halichoeres prosopeion)
(Halichoeres prosopeion)
Coral Damsel - Damselfish
(Pomacentrus maafu)
(Pomacentrus maafu)
Twospot Bristletooth - Surgeonfish
(Ctenochaetus binotatus)
(Ctenochaetus binotatus)
Blue-barred Parrotfish - Parrotfish
(Scarus ghobban)
(Scarus ghobban)
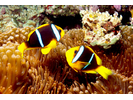
Orangefin Anemonefish - Damselfish
(Amphiprion chrysopterus)
(Amphiprion chrysopterus)
Humpback Snapper - Snapper
(Lutjanus gibbus)
(Lutjanus gibbus)
Blackbelt Hogfish - Wrasse
(Bodianus mesothorax)
(Bodianus mesothorax)
Terry's Dwarfgoby (pka Whitestriped DG) - Goby
(Eviota teresae (pka E. guttata))
(Eviota teresae (pka E. guttata))
Blackstreak Surgeonfish - Surgeonfish
(Acanthurus nigricauda)
(Acanthurus nigricauda)
Deep Reef Chromis - Damselfish
(Pycnochromis delta)
(Pycnochromis delta)
Disappearing Wrasse - Wrasse
(Pseudocheilinus evanidus)
(Pseudocheilinus evanidus)
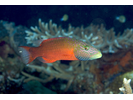
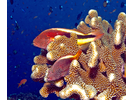
Freckled Hawkfish - Hawkfish
(Paracirrhites forsteri)
(Paracirrhites forsteri)
Mimic Surgeonfish - Surgeonfish
(Acanthurus pyroferus)
(Acanthurus pyroferus)
Neon Damsel - Damselfish
(Pomacentrus coelestis)
(Pomacentrus coelestis)
Blackbar Wrasse - Wrasse
(Thalassoma nigrofasciatum)
(Thalassoma nigrofasciatum)
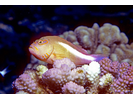
Coral Grouper - Grouper
(Cephalopholis miniata)
(Cephalopholis miniata)

Singular Bannerfish - Butterflyfish
(Heniochus singularius)
(Heniochus singularius)
Weber's Chromis - Damselfish
(Chromis weberi)
(Chromis weberi)
Scaly Chromis - Damselfish
(Azurina lepidolepis)
(Azurina lepidolepis)
Tubelip Wrasse - Wrasse
(Labrichthys unilineatus)
(Labrichthys unilineatus)
Black-banded Snapper - Snapper
(Lutjanus semicinctus)
(Lutjanus semicinctus)
Steephead Parrotfish - Parrotfish
(Chlorurus microrhinos)
(Chlorurus microrhinos)
Onespot Snapper - Snapper
(Lutjanus monostigma)
(Lutjanus monostigma)
Orbicular Damsel - Damselfish
(Amblyglyphidodon orbicularis)
(Amblyglyphidodon orbicularis)
Dash-dot Goatfish - Goatfish
(Parupeneus barberinus)
(Parupeneus barberinus)
Yellowtail Coris - Wrasse
(Coris gaimard)
(Coris gaimard)
Goldsaddle Goatfish - Goatfish
(Parupeneus cyclostomus)
(Parupeneus cyclostomus)
Black-axil Chromis - Damselfish
(Chromis atripectoralis)
(Chromis atripectoralis)
Blackspotted Puffer - Puffer/Toby
(Arothron nigropunctatus)
(Arothron nigropunctatus)
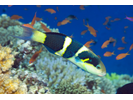
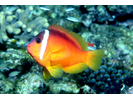
Fiji Anemonefish - Damselfish
(Amphiprion barberi)
(Amphiprion barberi)
Midnight Snapper - Snapper
(Macolor macularis)
(Macolor macularis)
Paletail Unicornfish - Surgeonfish
(Naso brevirostris)
(Naso brevirostris)

Dwarf Hawkfish - Hawkfish
(Cirrhitichthys falco)
(Cirrhitichthys falco)
Magenta Slender Anthias - Grouper
(Luzonichthys waitei)
(Luzonichthys waitei)

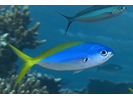
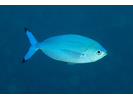
Blue and Yellow Fusilier - Fusilier
(Caesio teres)
(Caesio teres)
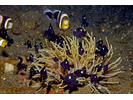
Longnose Filefish - Filefish
(Oxymonacanthus longirostris)
(Oxymonacanthus longirostris)
Atoll (pka Yellowback) Butterflyfish - Butterflyfish
(Chaetodon mertensii)
(Chaetodon mertensii)
Piano Fangblenny - Blenny
(Plagiotremus tapeinosoma)
(Plagiotremus tapeinosoma)
Pink Anemonefish - Damselfish
(Amphiprion perideraion)
(Amphiprion perideraion)

Lunar Fusilier - Fusilier
(Caesio lunaris)
(Caesio lunaris)
Orange-Spotted (aka Tonga) Damsel - Damselfish
(Pomacentrus spilotoceps)
(Pomacentrus spilotoceps)
Scissortail Sergeant - Damselfish
(Abudefduf sexfasciatus)
(Abudefduf sexfasciatus)
Yellowmask Surgeonfish - Surgeonfish
(Acanthurus mata)
(Acanthurus mata)
Arc-eye Hawkfish - Hawkfish
(Paracirrhites arcatus)
(Paracirrhites arcatus)
Epaulette Soldierfish - Squirrelfish
(Myripristis kuntee)
(Myripristis kuntee)
Fire Dartfish - Dartfish
(Nemateleotris magnifica)
(Nemateleotris magnifica)
Latticed Butterflyfish - Butterflyfish
(Chaetodon rafflesi)
(Chaetodon rafflesi)

Leopard Wrasse - Wrasse
(Macropharyngodon meleagris)
(Macropharyngodon meleagris)
Bicolor Rabbitfish - Rabbitfish
(Siganus uspi)
(Siganus uspi)
Black Leopard Wrasse - Wrasse
(Macropharyngodon negrosensis)
(Macropharyngodon negrosensis)
Redlip Parrotfish - Parrotfish
(Scarus rubroviolaceus)
(Scarus rubroviolaceus)
Flagtail Triggerfish - Triggerfish
(Sufflamen chrysopterus (pka S chrysopterum))
(Sufflamen chrysopterus (pka S chrysopterum))
Pacific Half-and-half Chromis - Damselfish
(Pycnochromis iomelas)
(Pycnochromis iomelas)

Striped Dwarfgoby - Goby
(Eviota sebreei)
(Eviota sebreei)
Bicolor Coralblenny - Blenny
(Ecsenius bicolor)
(Ecsenius bicolor)
Pennant Bannerfish - Butterflyfish
(Heniochus chrysostomus)
(Heniochus chrysostomus)
Magenta Dottyback - Dottyback
(Pictichromis porphyrea)
(Pictichromis porphyrea)
Blue-green Chromis - Damselfish
(Chromis viridis)
(Chromis viridis)

Reef Lizardfish - Lizardfish
(Synodus variegatus)
(Synodus variegatus)
Striped Surgeonfish - Surgeonfish
(Acanthurus lineatus)
(Acanthurus lineatus)
Teardrop Butterflyfish - Butterflyfish
(Chaetodon unimaculatus)
(Chaetodon unimaculatus)
Black-backed Butterflyfish - Butterflyfish
(Chaetodon melannotus)
(Chaetodon melannotus)
Tailspot Squirrelfish - Squirrelfish
(Sargocentron caudimaculatum)
(Sargocentron caudimaculatum)
Toothy / Fivelined Cardinalfish - Cardinalfish
(Cheilodipterus isostigmus / Cheilodipterus quinque)
(Cheilodipterus isostigmus / Cheilodipterus quinque)
Gold-spotted Rabbitfish - Rabbitfish
(Siganus punctatus)
(Siganus punctatus)
Humpnose Bigeye Bream - Emperor
(Monotaxis grandoculis)
(Monotaxis grandoculis)
Longnose Butterflyfish - Butterflyfish
(Forcipiger flavissimus)
(Forcipiger flavissimus)
Scissortail Fusilier - Fusilier
(Caesio caerulaurea)
(Caesio caerulaurea)
Sidespot Goatfish - Goatfish
(Parupeneus pleurostigma)
(Parupeneus pleurostigma)
Palenose Parrotfish - Parrotfish
(Scarus psittacus)
(Scarus psittacus)
Chevroned Butterflyfish - Butterflyfish
(Chaetodon trifascialis)
(Chaetodon trifascialis)
Flagtail Grouper - Grouper
(Cephalopholis urodeta)
(Cephalopholis urodeta)
Doublebar Goatfish - Goatfish
(Parupeneus crassilabris)
(Parupeneus crassilabris)
Pixy Hawkfish - Hawkfish
(Cirrhitichthys oxycephalus)
(Cirrhitichthys oxycephalus)
Threadfin Butterflyfish - Butterflyfish
(Chaetodon auriga)
(Chaetodon auriga)
Spotted Parrotfish - Parrotfish
(Cetoscarus ocellatus)
(Cetoscarus ocellatus)
Yellowbanded Sandperch (pka Speckled SP) - Sandperch
(Parapercis xanthogramma)
(Parapercis xanthogramma)
Black-spot Angelfish - Angelfish
(Genicanthus melanospilos)
(Genicanthus melanospilos)
Midas Coralblenny - Blenny
(Ecsenius midas)
(Ecsenius midas)
Trumpetfish - Trumpetfish
(Aulostomus chinensis)
(Aulostomus chinensis)
Pinktail Triggerfish - Triggerfish
(Melichthys vidua)
(Melichthys vidua)
Ringtailed Cardinalfish - Cardinalfish
(Ostorhinchus aureus)
(Ostorhinchus aureus)
Masked Bannerfish - Butterflyfish
(Heniochus monoceros)
(Heniochus monoceros)
Spotted Shrimpgoby - Goby
(Amblyeleotris guttata)
(Amblyeleotris guttata)
Yellow Chromis - Damselfish
(Chromis analis)
(Chromis analis)
Whitetip Soldierfish - Squirrelfish
(Myripristis vittata)
(Myripristis vittata)
Pale-tail Chromis - Damselfish
(Chromis xanthura)
(Chromis xanthura)
Redshoulder Wrasse - Wrasse
(Stethojulis bandanensis)
(Stethojulis bandanensis)
Twinspot Chromis - Damselfish
(Azurina elerae)
(Azurina elerae)
Barred Thicklip - Wrasse
(Hemigymnus fasciatus)
(Hemigymnus fasciatus)
Blue-spot Butterflyfish - Butterflyfish
(Chaetodon plebeius)
(Chaetodon plebeius)
Orangeband Surgeonfish - Surgeonfish
(Acanthurus olivaceus)
(Acanthurus olivaceus)
Chameleon Parrotfish - Parrotfish
(Scarus chameleon)
(Scarus chameleon)
Many-spotted Sweetlips - Sweetlips
(Plectorhinchus chaetodonoides)
(Plectorhinchus chaetodonoides)
Southern Tubelip - Wrasse
(Labropsis australis)
(Labropsis australis)
Yellow-breasted Wrasse - Wrasse
(Anampses twistii)
(Anampses twistii)
Longnose (Pacific) Parrotfish - Parrotfish
(Hipposcarus longiceps)
(Hipposcarus longiceps)
Blue Velvet Angelfish - Angelfish
(Centropyge deborae)
(Centropyge deborae)
Hawk Anthias - Grouper
(Serranocirrhitus latus)
(Serranocirrhitus latus)
Fiji Clown Coralblenny - Blenny
(Ecsenius fijiensis)
(Ecsenius fijiensis)
Slender Fusilier - Fusilier
(Gymnocaesio gymnoptera)
(Gymnocaesio gymnoptera)
Fusilier Damsel - Damselfish
(Lepidozygus tapeinosoma)
(Lepidozygus tapeinosoma)
Latent Slingjaw Wrasse - Wrasse
(Epibulus brevis)
(Epibulus brevis)
Violet Soldierfish - Squirrelfish
(Myripristis violacea)
(Myripristis violacea)
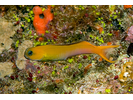
Bluestreak Goby - Goby
(Valenciennea strigata)
(Valenciennea strigata)
Spottail Dartfish - Dartfish
(Ptereleotris heteroptera)
(Ptereleotris heteroptera)
Bluefin Trevally - Jack
(Caranx melampygus)
(Caranx melampygus)
Bluestripe Snapper - Snapper
(Lutjanus kasmira)
(Lutjanus kasmira)
Floral Wrasse - Wrasse
(Cheilinus chlorourus)
(Cheilinus chlorourus)
Pale Pygmygoby - Goby
(Trimma anaima)
(Trimma anaima)
Black-saddled Toby - Puffer/Toby
(Canthigaster valentini)
(Canthigaster valentini)
Whitetail Surgeonfish - Surgeonfish
(Acanthurus thompsoni)
(Acanthurus thompsoni)
Dusky Wrasse (Pacific) - Wrasse
(Halichoeres annularis)
(Halichoeres annularis)
Greensnout Parrotfish - Parrotfish
(Scarus spinus)
(Scarus spinus)
Big-scale Soldierfish - Squirrelfish
(Myripristis berndti)
(Myripristis berndti)
Latticed Sandperch - Sandperch
(Parapercis clathrata)
(Parapercis clathrata)
Sleek Unicornfish - Surgeonfish
(Naso hexacanthus)
(Naso hexacanthus)
Whitetip Reef Shark - Requiem Shark
(Triaenodon obesus)
(Triaenodon obesus)
Purple Queen - Grouper
(Pseudanthias pascalus)
(Pseudanthias pascalus)
Stocky Anthias - Grouper
(Pseudanthias hypselosoma)
(Pseudanthias hypselosoma)
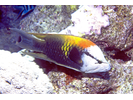
Redbreasted Wrasse - Wrasse
(Cheilinus fasciatus)
(Cheilinus fasciatus)
Redspot Wrasse - Wrasse
(Pseudocoris yamashiroi)
(Pseudocoris yamashiroi)
Smalltooth Jobfish - Snapper
(Aphareus furca)
(Aphareus furca)
Old Glory - Goby
(Koumansetta rainfordi)
(Koumansetta rainfordi)
Twotone Dartfish - Dartfish
(Ptereleotris evides)
(Ptereleotris evides)
Flagtail Blanquillo - Tilefish
(Malacanthus brevirostris)
(Malacanthus brevirostris)
Blackeye Thicklip - Wrasse
(Hemigymnus melapterus)
(Hemigymnus melapterus)
Mimic Filefish - Filefish
(Paraluteres prionurus)
(Paraluteres prionurus)
Staghorn Damsel - Damselfish
(Amblyglyphidodon curacao)
(Amblyglyphidodon curacao)
Ear-spot Dwarfgoby - Goby
(Eviota karaspila)
(Eviota karaspila)
Pacific Damsel - Damselfish
(Plectroglyphidodon fasciolatus)
(Plectroglyphidodon fasciolatus)
Oblique-lined Dottyback - Dottyback
(Cypho purpurascens)
(Cypho purpurascens)
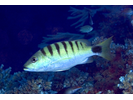
Peacock Grouper - Grouper
(Cephalopholis argus)
(Cephalopholis argus)
Rockmover Wrasse - Wrasse
(Novaculichthys taeniourus)
(Novaculichthys taeniourus)
Bridled Parrotfish - Parrotfish
(Scarus frenatus)
(Scarus frenatus)
Ringeye Pygmygoby - Goby
(Trimma benjamini)
(Trimma benjamini)
Snooty Wrasse - Wrasse
(Cheilinus oxycephalus)
(Cheilinus oxycephalus)
Spotted Garden Eel - Conger and Garden Eel
(Heteroconger hassi)
(Heteroconger hassi)
Bluestreak Fusilier - Fusilier
(Pterocaesio tile)
(Pterocaesio tile)
Honeycomb Grouper - Grouper
(Epinephelus merra)
(Epinephelus merra)
Shimada/Sigillata Dwarfgoby - Goby
(Eviota shimada/Eviota sigillata)
(Eviota shimada/Eviota sigillata)
Sunset Wrasse - Wrasse
(Thalassoma lutescens)
(Thalassoma lutescens)
Bluelipped Bristletooth - Surgeonfish
(Ctenochaetus cyanocheilus)
(Ctenochaetus cyanocheilus)
Red-streaked Blenny - Blenny
(Cirripectes stigmaticus)
(Cirripectes stigmaticus)
Clown Triggerfish - Triggerfish
(Balistoides conspicillum)
(Balistoides conspicillum)
Iridescent Cardinalfish - Cardinalfish
(Pristiapogon kallopterus)
(Pristiapogon kallopterus)
Tripletail Wrasse - Wrasse
(Cheilinus trilobatus)
(Cheilinus trilobatus)
Exquisite Fairy Wrasse - Wrasse
(Cirrhilabrus exquisitus)
(Cirrhilabrus exquisitus)
Filament-fin Parrotfish - Parrotfish
(Scarus altipinnis)
(Scarus altipinnis)
Yellow Boxfish - Boxfish
(Ostracion cubicus)
(Ostracion cubicus)
Clown Coris - Wrasse
(Coris aygula)
(Coris aygula)
Gray Reef Shark - Requiem Shark
(Carcharhinus amblyrhynchos)
(Carcharhinus amblyrhynchos)
Orangetip Bristletooth - Surgeonfish
(Ctenochaetus tominiensis)
(Ctenochaetus tominiensis)
Threespot Wrasse - Wrasse
(Halichoeres trimaculatus)
(Halichoeres trimaculatus)
Fivestripe Wrasse - Wrasse
(Thalassoma quinquevittatum)
(Thalassoma quinquevittatum)
Yellow-edged Lyretail - Grouper
(Variola louti)
(Variola louti)
Yellowmargin Triggerfish - Triggerfish
(Pseudobalistes flavimarginatus)
(Pseudobalistes flavimarginatus)
Blacktail Snapper - Snapper
(Lutjanus fulvus)
(Lutjanus fulvus)
Longspot Snapper - Snapper
(Lutjanus fulviflamma)
(Lutjanus fulviflamma)
Semicircle Angelfish - Angelfish
(Pomacanthus semicirculatus)
(Pomacanthus semicirculatus)
Bicolor Cleaner Wrasse - Wrasse
(Labroides bicolor)
(Labroides bicolor)
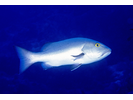
Black Snapper - Snapper
(Macolor niger)
(Macolor niger)
Cave Pygmygoby - Goby
(Trimma taylori)
(Trimma taylori)
Chiseltooth Wrasse - Wrasse
(Pseudodax moluccanus/mollucanus)
(Pseudodax moluccanus/mollucanus)
Forktail Rabbitfish - Rabbitfish
(Siganus argenteus)
(Siganus argenteus)
Threestripe Fusilier - Fusilier
(Pterocaesio trilineata)
(Pterocaesio trilineata)
Violet Squirrelfish - Squirrelfish
(Sargocentron violaceum)
(Sargocentron violaceum)
Port-hole Pygmygoby - Goby
(Trimma finistrinum)
(Trimma finistrinum)
Wolf Cardinalfish - Cardinalfish
(Cheilodipterus artus)
(Cheilodipterus artus)
Bluepatch Parrotfish - Parrotfish
(Scarus forsteni)
(Scarus forsteni)
Lined Butterflyfish - Butterflyfish
(Chaetodon lineolatus)
(Chaetodon lineolatus)
Steinitz' Shrimpgoby - Goby
(Amblyeleotris steinitzi)
(Amblyeleotris steinitzi)
Blackfin Hogfish - Wrasse
(Bodianus loxozonus)
(Bodianus loxozonus)
Claudia's Wrasse (prev. misid as Ornate Wrasse) - Wrasse
(Halichoeres claudia)
(Halichoeres claudia)
Masked Grouper - Grouper
(Gracila albomarginata)
(Gracila albomarginata)
Striped Goby - Goby
(Asterropteryx striata)
(Asterropteryx striata)
Humphead Wrasse - Wrasse
(Cheilinus undulatus)
(Cheilinus undulatus)
Pickhandle Barracuda - Barracuda
(Sphyraena jello)
(Sphyraena jello)
Squarespot Anthias - Grouper
(Pseudanthias pleurotaenia)
(Pseudanthias pleurotaenia)
Wedge-tailed Wrasse - Wrasse
(Labropsis xanthonota)
(Labropsis xanthonota)
Bigeye Trevally - Jack
(Caranx sexfasciatus)
(Caranx sexfasciatus)
Vanderbilt's Chromis - Damselfish
(Pycnochromis vanderbilti)
(Pycnochromis vanderbilti)
Big Longnose Butterflyfish - Butterflyfish
(Forcipiger longirostris)
(Forcipiger longirostris)
Double-lined Fusilier - Fusilier
(Pterocaesio digramma)
(Pterocaesio digramma)
Saddle Grouper - Grouper
(Cephalopholis sexmaculata)
(Cephalopholis sexmaculata)
Yellow-speckled Chromis - Damselfish
(Chromis alpha)
(Chromis alpha)
Double-tooth Soldierfish - Squirrelfish
(Myripristis hexagona)
(Myripristis hexagona)
Indo-Pacific Sergeant - Damselfish
(Abudefduf vaigiensis)
(Abudefduf vaigiensis)
Leopard Coral Grouper - Grouper
(Plectropomus leopardus)
(Plectropomus leopardus)
Orange-dashed Goby - Goby
(Valenciennea puellaris)
(Valenciennea puellaris)
Pastel Ring Wrasse - Wrasse
(Hologymnosus doliatus)
(Hologymnosus doliatus)
Triplespot Blenny - Blenny
(Crossosalarias macrospilus)
(Crossosalarias macrospilus)
Emperor Angelfish - Angelfish
(Pomacanthus imperator)
(Pomacanthus imperator)
Honey-bee Pygmygoby - Goby
(Trimma anthrenum)
(Trimma anthrenum)
Spaghetti Garden Eel - Conger and Garden Eel
(Gorgasia maculata)
(Gorgasia maculata)
Unidentified Cirripectes Blenny Sp. - Blenny
(Cirripectes sp.)
(Cirripectes sp.)
Unidentified Coralgoby spp. - Goby
(Gobiodon and Paragobiodon spp.)
(Gobiodon and Paragobiodon spp.)
White-tailed Pygmy Angelfish - Angelfish
(Centropyge fisheri)
(Centropyge fisheri)
Barred Rabbitfish - Rabbitfish
(Siganus doliatus)
(Siganus doliatus)
False-comet Dwarfgoby - Goby
(Eviota oculineata)
(Eviota oculineata)
Honeycomb Toby - Puffer/Toby
(Canthigaster janthinoptera)
(Canthigaster janthinoptera)
Arrowhead Soapfish - Grouper
(Belonoperca chabanaudi)
(Belonoperca chabanaudi)
Cornetfish - Cornetfish
(Fistularia commersonii)
(Fistularia commersonii)
Raccoon Butterflyfish - Butterflyfish
(Chaetodon lunula)
(Chaetodon lunula)
Shoulderbar Goby - Goby
(Gnatholepis cauerensis)
(Gnatholepis cauerensis)
Spurcheek Cardinalfish - Cardinalfish
(Pristiapogon fraenatus)
(Pristiapogon fraenatus)
Tiger Cardinalfish - Cardinalfish
(Cheilodipterus macrodon)
(Cheilodipterus macrodon)
Bigeye Pygmygoby - Goby
(Trimma macrophthalmum)
(Trimma macrophthalmum)
Blackfin Barracuda - Barracuda
(Sphyraena qenie)
(Sphyraena qenie)
Fourline Wrasse - Wrasse
(Stethojulis trilineata)
(Stethojulis trilineata)
Scarlet Soldierfish - Squirrelfish
(Myripristis pralinia)
(Myripristis pralinia)
Sharksucker - Remora
(Echeneis naucrates)
(Echeneis naucrates)
Strawberry Grouper - Grouper
(Cephalopholis spiloparaea)
(Cephalopholis spiloparaea)
Wirenet Filefish - Filefish
(Cantherhines pardalis)
(Cantherhines pardalis)
Bicolor Goatfish - Goatfish
(Parupeneus barberinoides)
(Parupeneus barberinoides)
Humbug Dascyllus - Damselfish
(Dascyllus aruanus)
(Dascyllus aruanus)
Redspotted Sandperch - Sandperch
(Parapercis schauinslandii)
(Parapercis schauinslandii)
Splendid Pencil Wrasse - Wrasse
(Pseudojuloides splendens)
(Pseudojuloides splendens)
Striped Cardinalfish - Cardinalfish
(Ostorhinchus angustatus)
(Ostorhinchus angustatus)
Three-spot Angelfish - Angelfish
(Apolemichthys trimaculatus)
(Apolemichthys trimaculatus)
Yellowfin Surgeonfish - Surgeonfish
(Acanthurus xanthopterus)
(Acanthurus xanthopterus)
Axilspot Hogfish - Wrasse
(Bodianus axillaris)
(Bodianus axillaris)
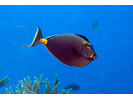
Brown Surgeonfish - Surgeonfish
(Acanthurus nigrofuscus)
(Acanthurus nigrofuscus)
Giant Moray - Moray
(Gymnothorax javanicus)
(Gymnothorax javanicus)
Pale-barred Coris - Wrasse
(Coris dorsomacula)
(Coris dorsomacula)
Reticulated Butterflyfish - Butterflyfish
(Chaetodon reticulatus)
(Chaetodon reticulatus)
Ring Wrasse - Wrasse
(Hologymnosus annulatus)
(Hologymnosus annulatus)
Yellow-barred Parrotfish - Parrotfish
(Scarus dimidiatus)
(Scarus dimidiatus)
Blue Blanquillo - Tilefish
(Malacanthus latovittatus)
(Malacanthus latovittatus)
Bluehead Tilefish - Tilefish
(Hoplolatilus starcki)
(Hoplolatilus starcki)
Double-lined Mackerel - Mackerel and Tuna
(Grammatorcynus bilineatus)
(Grammatorcynus bilineatus)
Green Jobfish - Snapper
(Aprion virescens)
(Aprion virescens)
Red-margined Fairy Wrasse - Wrasse
(Cirrhilabrus rubrimarginatus)
(Cirrhilabrus rubrimarginatus)
Signalfin Sandgoby - Goby
(Fusigobius signipinnis)
(Fusigobius signipinnis)
Weedy Surge Wrasse - Wrasse
(Halichoeres margaritaceus)
(Halichoeres margaritaceus)
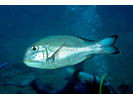
Crescent-tail Bigeye - Bigeye
(Priacanthus hamrur)
(Priacanthus hamrur)
Dark-capped Parrotfish - Parrotfish
(Scarus oviceps)
(Scarus oviceps)
Five-lined Snapper - Snapper
(Lutjanus quinquelineatus)
(Lutjanus quinquelineatus)
Johnston Damsel - Damselfish
(Plectroglyphidodon johnstonianus)
(Plectroglyphidodon johnstonianus)
Lori's Anthias - Grouper
(Pseudanthias lori)
(Pseudanthias lori)
Spotted Boxfish - Boxfish
(Ostracion meleagris)
(Ostracion meleagris)
Violet-lined Parrotfish - Parrotfish
(Scarus globiceps)
(Scarus globiceps)
Blubberlip Snapper - Snapper
(Lutjanus rivulatus)
(Lutjanus rivulatus)
Gorgeous Shrimpgoby - Goby
(Amblyeleotris wheeleri)
(Amblyeleotris wheeleri)
Highfin Grouper - Grouper
(Epinephelus maculatus)
(Epinephelus maculatus)
Longface Emperor - Emperor
(Lethrinus olivaceus)
(Lethrinus olivaceus)
Marjorie's Fairy Wrasse - Wrasse
(Cirrhilabrus marjorie)
(Cirrhilabrus marjorie)
Sabre Squirrelfish - Squirrelfish
(Sargocentron spiniferum)
(Sargocentron spiniferum)
Blue Triggerfish - Triggerfish
(Pseudobalistes fuscus)
(Pseudobalistes fuscus)
Carlson's Damsel - Damselfish
(Neoglyphidodon carlsoni)
(Neoglyphidodon carlsoni)
Leopard Blenny (E. brevis) - Blenny
(Exallias brevis)
(Exallias brevis)
Leopard Grouper - Grouper
(Cephalopholis leopardus)
(Cephalopholis leopardus)
Pinkeye Goby - Goby
(Bryaninops natans)
(Bryaninops natans)
Redtooth Triggerfish - Triggerfish
(Odonus niger)
(Odonus niger)
Slender Pinjalo - Snapper
(Pinjalo lewisi)
(Pinjalo lewisi)
Whitespotted Grouper - Grouper
(Epinephelus coeruleopunctatus)
(Epinephelus coeruleopunctatus)
Yellowfin Goatfish - Goatfish
(Mulloidichthys vanicolensis)
(Mulloidichthys vanicolensis)
Ornate Butterflyfish - Butterflyfish
(Chaetodon ornatissimus)
(Chaetodon ornatissimus)
Randall's Shrimpgoby - Goby
(Amblyeleotris randalli)
(Amblyeleotris randalli)
Spotfin Squirrelfish - Squirrelfish
(Neoniphon sammara)
(Neoniphon sammara)
Two-spot Snapper - Snapper
(Lutjanus biguttatus)
(Lutjanus biguttatus)
Morrison's Dragonet - Dragonet
(Synchiropus morrisoni)
(Synchiropus morrisoni)
Orange-striped Emperor - Emperor
(Lethrinus obsoletus)
(Lethrinus obsoletus)
Redspotted Blenny - Blenny
(Blenniella chrysospilos)
(Blenniella chrysospilos)
Spot-nape Butterflyfish - Butterflyfish
(Chaetodon oxycephalus)
(Chaetodon oxycephalus)
White-edged Lyretail - Grouper
(Variola albimarginata)
(Variola albimarginata)
Yellowfin Emperor - Emperor
(Lethrinus erythracanthus)
(Lethrinus erythracanthus)
Blueline Damsel - Damselfish
(Chrysiptera caeruleolineata)
(Chrysiptera caeruleolineata)
Decorated Dartfish - Dartfish
(Nemateleotris decora)
(Nemateleotris decora)
Dusky Gregory - Damselfish
(Stegastes nigricans)
(Stegastes nigricans)
Geographic Wrasse - Wrasse
(Anampses geographicus)
(Anampses geographicus)
Palette Surgeonfish - Surgeonfish
(Paracanthurus hepatus)
(Paracanthurus hepatus)
Slender Reef-damsel - Damselfish
(Pomachromis richardsoni)
(Pomachromis richardsoni)
Wide-band Fusilier - Fusilier
(Pterocaesio lativittata)
(Pterocaesio lativittata)
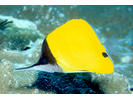
Yellow Pygmy Angelfish - Angelfish
(Centropyge heraldi)
(Centropyge heraldi)
Yellowtail Wrasse - Wrasse
(Anampses meleagrides)
(Anampses meleagrides)
Blackfin Squirrelfish - Squirrelfish
(Neoniphon opercularis)
(Neoniphon opercularis)
Eyebrow Large-eye Bream - Emperor
(Gymnocranius superciliosus)
(Gymnocranius superciliosus)
Goldstripe Wrasse - Wrasse
(Halichoeres hartzfeldii)
(Halichoeres hartzfeldii)
Oriental Sweetlips - Sweetlips
(Plectorhinchus vittatus)
(Plectorhinchus vittatus)
Redcoat Squirrelfish - Squirrelfish
(Sargocentron rubrum)
(Sargocentron rubrum)
Unidentified Silversides sp. - Silversides
(Unidentified Silversides sp.)
(Unidentified Silversides sp.)
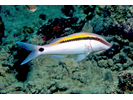
Yellow-striped Whiptail - Coral Bream
(Pentapodus aureofasciatus)
(Pentapodus aureofasciatus)
Blue-spotted Wrasse - Wrasse
(Anampses caeruleopunctatus)
(Anampses caeruleopunctatus)
False Cleanerfish - Blenny
(Aspidontus taeniatus)
(Aspidontus taeniatus)
Fiji Damsel - Damselfish
(Pomacentrus microspilus)
(Pomacentrus microspilus)
Giant clam spp. - Giant Clams
(Tridachna spp.)
(Tridachna spp.)
Long-jawed Mackerel - Mackerel and Tuna
(Rastrelliger kanagurta)
(Rastrelliger kanagurta)
Squaretail Coral Grouper - Grouper
(Plectropomus areolatus)
(Plectropomus areolatus)
Yellow-Red Pygmygoby / Exquisite Pygmygoby - Goby
(Trimma xanthum / Trimma preclarum)
(Trimma xanthum / Trimma preclarum)
Camouflage Grouper - Grouper
(Epinephelus polyphekadion)
(Epinephelus polyphekadion)
Creamback Dwarfgoby - Goby
(Eviota dorsogilva)
(Eviota dorsogilva)
Flame Hawkfish - Hawkfish
(Neocirrhites armatus)
(Neocirrhites armatus)
Red & Whitespotted Dwarfgoby - Goby
(Eviota prasites)
(Eviota prasites)
Schroeder’s (pttb Batu) Coris - Wrasse
(Coris schroederii)
(Coris schroederii)
Blackspot Snapper - Snapper
(Lutjanus ehrenbergii)
(Lutjanus ehrenbergii)
Clouded Lizardfish - Lizardfish
(Saurida nebulosa)
(Saurida nebulosa)
Curious Wormfish - Wormfish
(Gunnellichthys curiosus)
(Gunnellichthys curiosus)
Multi-barred Angelfish - Angelfish
(Centropyge multifasciata)
(Centropyge multifasciata)
Red Lionfish - Scorpionfish and Lionfish
(Pterois volitans)
(Pterois volitans)
Threadfin Dartfish - Dartfish
(Ptereleotris hanae)
(Ptereleotris hanae)
Whitespot Cardinalfish - Cardinalfish
(Ostorhinchus dispar)
(Ostorhinchus dispar)
Yellowtail Emperor - Emperor
(Lethrinus atkinsoni)
(Lethrinus atkinsoni)
Blackheaded Filefish - Filefish
(Pervagor melanocephalus)
(Pervagor melanocephalus)
Blacksaddle Grouper - Grouper
(Epinephelus howlandi)
(Epinephelus howlandi)
Blacktip Sandgoby - Goby
(Fusigobius melacron)
(Fusigobius melacron)
Brown Coralblenny - Blenny
(Atrosalarias fuscus)
(Atrosalarias fuscus)
Brown-banded Pipefish - Pipefish and Seahorse
(Corythoichthys amplexus)
(Corythoichthys amplexus)
Greybeard Pygmygoby - Goby
(Trimma annosum)
(Trimma annosum)
Speckled-fin Grouper - Grouper
(Epinephelus ongus)
(Epinephelus ongus)
Surge Damsel (Pacific) - Damselfish
(Chrysiptera leucopoma)
(Chrysiptera leucopoma)
Twospot Wrasse (O. bimaculatus) - Wrasse
(Oxycheilinus bimaculatus)
(Oxycheilinus bimaculatus)
Blackwedge Tuskfish - Wrasse
(Choerodon jordani)
(Choerodon jordani)
Crown Squirrelfish - Squirrelfish
(Sargocentron diadema)
(Sargocentron diadema)
Five-lined Coralgoby - Goby
(Gobiodon quinquestrigatus)
(Gobiodon quinquestrigatus)
Manyline Basslet - Basslet / Seabass
(Liopropoma multilineatum)
(Liopropoma multilineatum)
Nasal Pygmygoby - Goby
(Trimma nasa)
(Trimma nasa)
Pacific Cryptic Wrasse (aka Thrush Sneaky Wrasse) - Wrasse
(Pteragogus turdus (pttb P. cryptus))
(Pteragogus turdus (pttb P. cryptus))
Whitemargin Unicornfish - Surgeonfish
(Naso annulatus)
(Naso annulatus)
Banded Goby - Goby
(Amblygobius phalaena)
(Amblygobius phalaena)
Black-breasted Pipefish - Pipefish and Seahorse
(Corythoichthys nigripectus)
(Corythoichthys nigripectus)
Blackblotch Emperor - Emperor
(Lethrinus semicinctus)
(Lethrinus semicinctus)
Blackblotch Lizardfish - Lizardfish
(Synodus jaculum)
(Synodus jaculum)
Blue Trevally - Jack
(Carangoides ferdau)
(Carangoides ferdau)
Bluespine Unicornfish - Surgeonfish
(Naso unicornis)
(Naso unicornis)
Goldbelly Cardinalfish - Cardinalfish
(Ostorhinchus apogonoides (aka apogonides))
(Ostorhinchus apogonoides (aka apogonides))
Narrow Barred Spanish Mackerel - Mackerel and Tuna
(Scomberomorus commerson)
(Scomberomorus commerson)
Orange-socket Surgeonfish - Surgeonfish
(Acanthurus auranticavus)
(Acanthurus auranticavus)
Orangespotted Goby - Goby
(Istigobius rigilius)
(Istigobius rigilius)
Ringtail Surgeonfish - Surgeonfish
(Acanthurus blochii)
(Acanthurus blochii)
Surf Parrotfish - Parrotfish
(Scarus rivulatus)
(Scarus rivulatus)
Three-line Wrasse - Wrasse
(Stethojulis strigiventer)
(Stethojulis strigiventer)
Yellownose Shrimpgoby - Goby
(Stonogobiops xanthorhinica)
(Stonogobiops xanthorhinica)
Chestnut Blenny - Blenny
(Cirripectes castaneus)
(Cirripectes castaneus)
Clearfin Squirrelfish - Squirrelfish
(Neoniphon argenteus)
(Neoniphon argenteus)
Japanese Parrotfish - Parrotfish
(Chlorurus japanensis)
(Chlorurus japanensis)
Leaf Scorpionfish - Scorpionfish and Lionfish
(Taenianotus triacanthus)
(Taenianotus triacanthus)
Longnose Hawkfish - Hawkfish
(Oxycirrhites typus)
(Oxycirrhites typus)
Stonycoral Ghostgoby - Goby
(Pleurosicya micheli)
(Pleurosicya micheli)
Twinstripe Fusilier - Fusilier
(Pterocaesio marri)
(Pterocaesio marri)
Blotched Sandgoby - Goby
(Fusigobius inframaculatus)
(Fusigobius inframaculatus)
Bluntsnout Gregory - Damselfish
(Stegastes punctatus)
(Stegastes punctatus)
Broad-banded Shrimpgoby - Goby
(Amblyeleotris periophthalma)
(Amblyeleotris periophthalma)
Broom Filefish - Filefish
(Amanses scopas)
(Amanses scopas)
Bundoon Fangblenny - Blenny
(Meiacanthus bundoon)
(Meiacanthus bundoon)
Helfrich's Dartfish - Dartfish
(Nemateleotris helfrichi)
(Nemateleotris helfrichi)
Longfin Perchlet - Grouper
(Plectranthias longimanus)
(Plectranthias longimanus)
Lowfin Chub/Drummer - Chub (Drummer)
(Kyphosus vaigiensis)
(Kyphosus vaigiensis)
Luzon Anthias - Grouper
(Pseudanthias luzonensis)
(Pseudanthias luzonensis)
Mangrove Snapper - Snapper
(Lutjanus argentimaculatus)
(Lutjanus argentimaculatus)
Midget Chromis - Damselfish
(Pycnochromis acares)
(Pycnochromis acares)
Silverstreak Anthias - Grouper
(Pseudanthias cooperi)
(Pseudanthias cooperi)
Striped Large-eye Bream - Emperor
(Gnathodentex aureolineatus)
(Gnathodentex aureolineatus)
Topsail Chub/Drummer - Chub (Drummer)
(Kyphosus cinerascens)
(Kyphosus cinerascens)
Unidentified Pygmygoby - Trimma sp. - Goby
(Trimma sp.)
(Trimma sp.)
Yellow-red Pygmygoby - Goby
(Trimma xanthum)
(Trimma xanthum)
Yellowstriped Cardinalfish - Cardinalfish
(Ostorhinchus cyanosoma)
(Ostorhinchus cyanosoma)
Bigeye Barracuda - Barracuda
(Sphyraena forsteri)
(Sphyraena forsteri)
Blackspot Squirrelfish - Squirrelfish
(Sargocentron melanospilos)
(Sargocentron melanospilos)
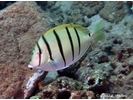
Convict Surgeonfish - Surgeonfish
(Acanthurus triostegus)
(Acanthurus triostegus)
Copper Sweeper - Sweeper
(Pempheris oualensis)
(Pempheris oualensis)
Dogtooth Tuna - Mackerel and Tuna
(Gymnosarda unicolor)
(Gymnosarda unicolor)
Great Barracuda - Barracuda
(Sphyraena barracuda)
(Sphyraena barracuda)
Hexagon Grouper - Grouper
(Epinephelus hexagonatus)
(Epinephelus hexagonatus)
Leather Coral Ghostgoby - Goby
(Pleurosicya muscarum)
(Pleurosicya muscarum)
Metallic Demoiselle - Damselfish
(Neopomacentrus metallicus)
(Neopomacentrus metallicus)
Pontohi Pygmy Seahorse - Pipefish and Seahorse
(Hippocampus pontohi)
(Hippocampus pontohi)
Richmond's Wrasse - Wrasse
(Halichoeres richmondi)
(Halichoeres richmondi)
Ringtail Wrasse - Wrasse
(Oxycheilinus unifasciatus)
(Oxycheilinus unifasciatus)
Samurai Squirrelfish - Squirrelfish
(Sargocentron ittodai)
(Sargocentron ittodai)
Schultz's Pipefish - Pipefish and Seahorse
(Corythoichthys schultzi)
(Corythoichthys schultzi)
Sharpnose Wrasse - Wrasse
(Wetmorella nigropinnata)
(Wetmorella nigropinnata)
Slender Unicornfish - Surgeonfish
(Naso lopezi)
(Naso lopezi)
Solor Boxfish - Boxfish
(Ostracion solorense)
(Ostracion solorense)
Three-lined Monocle Bream - Coral Bream
(Scolopsis trilineatus)
(Scolopsis trilineatus)
Throatspot (pka Pygmy) Blenny - Blenny
(Nannosalarias nativitatis)
(Nannosalarias nativitatis)
Twinspot Cardinalfish - Cardinalfish
(Taeniamia biguttata)
(Taeniamia biguttata)
Wire Coral Goby - Goby
(Bryaninops yongei)
(Bryaninops yongei)
Barred Filefish - Filefish
(Cantherhines dumerilii)
(Cantherhines dumerilii)
Blackbar Filefish - Filefish
(Pervagor janthinosoma)
(Pervagor janthinosoma)
Cardinal Goatfish - Goatfish
(Parupeneus ciliatus)
(Parupeneus ciliatus)
Charcoal Damsel - Damselfish
(Pomacentrus brachialis)
(Pomacentrus brachialis)
Dark Surgeonfish - Surgeonfish
(Acanthurus nubilus)
(Acanthurus nubilus)
Eightstripe Wrasse - Wrasse
(Pseudocheilinus octotaenia)
(Pseudocheilinus octotaenia)
False Fusilier - Snapper
(Paracaesio sordida)
(Paracaesio sordida)
Loki Whip Goby - Goby
(Bryaninops loki)
(Bryaninops loki)
Lyretail Hawkfish - Hawkfish
(Cyprinocirrhites polyactis)
(Cyprinocirrhites polyactis)
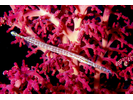
Network Pipefish - Pipefish and Seahorse
(Corythoichthys flavofasciatus)
(Corythoichthys flavofasciatus)
Pink Squirrelfish - Squirrelfish
(Sargocentron tiereoides)
(Sargocentron tiereoides)
Redtail / Red-tailed Flasher Wrasse - Wrasse
(Paracheilinus rubricaudalis)
(Paracheilinus rubricaudalis)
Ribbon Eel - Moray
(Rhinomuraena quaesita)
(Rhinomuraena quaesita)
Roundspot Surgeonfish - Surgeonfish
(Acanthurus bariene)
(Acanthurus bariene)
Rumengan's Pipehorse - Pipefish and Seahorse
(Kyonemichthys rumengani)
(Kyonemichthys rumengani)
Slender Grouper - Grouper
(Anyperodon leucogrammicus)
(Anyperodon leucogrammicus)
Southern Wrasse - Wrasse
(Stethojulis notialis)
(Stethojulis notialis)
Unidentified Dwarfgoby - Goby
(Eviota sp./Sueviota sp.)
(Eviota sp./Sueviota sp.)
Whitecap Shrimpgoby - Goby
(Lotilia graciliosa)
(Lotilia graciliosa)
Yellow and Black Pygmygoby - Goby
(Trimma flavatrum)
(Trimma flavatrum)
Zebra Dartfish - Dartfish
(Ptereleotris zebra)
(Ptereleotris zebra)
Brown-marbled Grouper - Grouper
(Epinephelus fuscoguttatus)
(Epinephelus fuscoguttatus)
Circular Spadefish - Spadefish
(Platax orbicularis)
(Platax orbicularis)
Common Ghostgoby - Goby
(Pleurosicya mossambica)
(Pleurosicya mossambica)
Double-spotted Queenfish - Jack
(Scomberoides lysan)
(Scomberoides lysan)
Hawksbill Sea Turtle - Sea Turtles
(Eretmochelys imbricata)
(Eretmochelys imbricata)
Lemon Coralgoby - Goby
(Gobiodon citrinus)
(Gobiodon citrinus)
Longnose Trevally - Jack
(Carangoides chrysophrys)
(Carangoides chrysophrys)
Lyretail Hogfish - Wrasse
(Bodianus anthioides)
(Bodianus anthioides)
Okinawa / Greybeard Pygmygoby - Goby
(Trimma okinawae / Trimma annosum)
(Trimma okinawae / Trimma annosum)
Redfin Anthias - Grouper
(Pseudanthias dispar)
(Pseudanthias dispar)
Robust Ghost Pipefish - Ghost Pipefish
(Solenostomus cyanopterus)
(Solenostomus cyanopterus)
Shadowfin Soldierfish - Squirrelfish
(Myripristis adusta)
(Myripristis adusta)
Silty Cardinalfish - Cardinalfish
(Ostorhinchus properuptus)
(Ostorhinchus properuptus)
Sixspot Goby - Goby
(Valenciennea sexguttata)
(Valenciennea sexguttata)
Southern Sharpnose Sandperch - Sandperch
(Parapercis australis)
(Parapercis australis)
Spotfin Lionfish - Scorpionfish and Lionfish
(Pterois antennata)
(Pterois antennata)
Spotted Eagle Ray - Eagle Ray
(Aetobatus ocellatus)
(Aetobatus ocellatus)
Thread Shrimpgoby - Goby
(Ctenogobiops mitodes)
(Ctenogobiops mitodes)
Threeband Damsel - Damselfish
(Chrysiptera tricincta)
(Chrysiptera tricincta)
Twospot Sandgoby - Goby
(Fusigobius duospilus)
(Fusigobius duospilus)
Twospot Slender Hogfish - Wrasse
(Bodianus bimaculatus)
(Bodianus bimaculatus)
Twostripe Goby - Goby
(Valenciennea helsdingenii)
(Valenciennea helsdingenii)
Blackfin Coralgoby - Goby
(Paragobiodon lacunicolus)
(Paragobiodon lacunicolus)
Blacktip Reef Shark - Requiem Shark
(Carcharhinus melanopterus)
(Carcharhinus melanopterus)
Caesiura Pygmygoby - Goby
(Trimma caesiura)
(Trimma caesiura)
Comet Dwarfgoby - Goby
(Eviota cometa)
(Eviota cometa)
Giant Trevally - Jack
(Caranx ignobilis)
(Caranx ignobilis)
Green Sea Turtle - Sea Turtles
(Chelonia mydas)
(Chelonia mydas)
Humpnose (aka Bulbnose) Unicornfish - Surgeonfish
(Naso tonganus)
(Naso tonganus)
Lachner's Dwarfgoby - Goby
(Sueviota lachneri)
(Sueviota lachneri)
Multi-barred Cardinalfish - Cardinalfish
(Nectamia luxuria)
(Nectamia luxuria)
Narrowstripe Cardinalfish - Cardinalfish
(Pristiapogon exostigma)
(Pristiapogon exostigma)
Orangelined Cardinalfish - Cardinalfish
(Taeniamia fucata)
(Taeniamia fucata)
Parva Goby - Goby
(Valenciennea parva)
(Valenciennea parva)
Porcupinefish - Porcupinefish
(Diodon hystrix)
(Diodon hystrix)
Redmouth Grouper - Grouper
(Aethaloperca rogaa)
(Aethaloperca rogaa)
Reef Manta Ray - Manta
(Mobula alfredi)
(Mobula alfredi)
Schooling Bannerfish - Butterflyfish
(Heniochus diphreutes)
(Heniochus diphreutes)
Scribbled Rabbitfish - Rabbitfish
(Siganus spinus)
(Siganus spinus)
Stareye Parrotfish - Parrotfish
(Calotomus carolinus)
(Calotomus carolinus)
Stout-body Chromis - Damselfish
(Chromis chrysura)
(Chromis chrysura)
Unidentified Whiptail - Coral Bream
(Pentapodus spp.)
(Pentapodus spp.)
Unidentified sea turtle - Sea Turtles
(Chelonioidea)
(Chelonioidea)
Allen's Cardinalfish - Cardinalfish
(Cheilodipterus alleni)
(Cheilodipterus alleni)
Bandfin Cardinalfish - Cardinalfish
(Pristiapogon taeniopterus)
(Pristiapogon taeniopterus)
Blotcheye Soldierfish - Squirrelfish
(Myripristis murdjan)
(Myripristis murdjan)
Blue-spotted Ribbontail Ray - Stingray
(Taeniura lymma)
(Taeniura lymma)
Bridled Triggerfish - Triggerfish
(Sufflamen fraenatum)
(Sufflamen fraenatum)
Cigar Wrasse - Wrasse
(Cheilio inermis)
(Cheilio inermis)
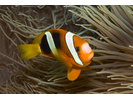
Clark's Anemonefish - Damselfish
(Amphiprion clarkii)
(Amphiprion clarkii)
Clearfin Lizardfish - Lizardfish
(Synodus dermatogenys)
(Synodus dermatogenys)
Crocodile Needlefish - Needlefish
(Tylosurus crocodilus)
(Tylosurus crocodilus)
Decorated Sandgoby - Goby
(Istigobius decoratus)
(Istigobius decoratus)
Devil Scorpionfish - Scorpionfish and Lionfish
(Scorpaenopsis diabolus)
(Scorpaenopsis diabolus)
Golden Trevally - Jack
(Gnathanodon speciosus)
(Gnathanodon speciosus)
Humpback Unicornfish - Surgeonfish
(Naso brachycentron)
(Naso brachycentron)
Longfin Spadefish - Spadefish
(Platax teira)
(Platax teira)
Mackerel Scad - Jack
(Decapterus macarellus)
(Decapterus macarellus)
Marbled (aka Black-blotched) Stingray - Stingray
(Taeniura meyeni)
(Taeniura meyeni)
Onespot Damsel - Damselfish
(Chrysiptera unimaculata)
(Chrysiptera unimaculata)
Orangestripe Wormfish - Wormfish
(Gunnellichthys viridescens)
(Gunnellichthys viridescens)
Pacific (aka Reef) Chromis - Damselfish
(Pycnochromis pacifica)
(Pycnochromis pacifica)
Palebarred Reefgoby - Goby
(Priolepis pallidicincta)
(Priolepis pallidicincta)
Papuan Scorpionfish - Scorpionfish and Lionfish
(Scorpaenopsis papuensis)
(Scorpaenopsis papuensis)
Peacock Flounder - Lefteye Flounder
(Bothus mancus)
(Bothus mancus)
Pearly Dartfish - Dartfish
(Ptereleotris microlepis)
(Ptereleotris microlepis)
Pinstriped Wrasse - Wrasse
(Halichoeres melanurus)
(Halichoeres melanurus)
Rainbow Runner - Jack
(Elagatis bipinnulata)
(Elagatis bipinnulata)
Red Goatfish - Goatfish
(Mulloidichthys pfluegeri)
(Mulloidichthys pfluegeri)
Redblotch Perchlet - Grouper
(Plectranthias winniensis)
(Plectranthias winniensis)
Sand Shrimpgoby - Goby
(Ctenogobiops feroculus)
(Ctenogobiops feroculus)
Scalloped Hammerhead - Hammerhead Shark
(Sphyrna lewini)
(Sphyrna lewini)
Shoulderspot Sandgoby - Goby
(Fusigobius humeralis)
(Fusigobius humeralis)
Shy Toby - Puffer/Toby
(Canthigaster ocellicincta)
(Canthigaster ocellicincta)
Six-lined Soapfish - Grouper
(Grammistes sexlineatus)
(Grammistes sexlineatus)
Slender Sabretooth Blenny - Blenny
(Aspidontus dussumieri)
(Aspidontus dussumieri)
Solander's Toby - Puffer/Toby
(Canthigaster solandri)
(Canthigaster solandri)
Spotted Sandperch - Sandperch
(Parapercis millepunctata)
(Parapercis millepunctata)
Star Puffer - Puffer/Toby
(Arothron stellatus)
(Arothron stellatus)
Thumbprint Emperor - Emperor
(Lethrinus harak)
(Lethrinus harak)
Unidentified Ghostgoby - Goby
(Pleurosicya sp)
(Pleurosicya sp)
Unidentified Nectamia sp. Cardinalfish - Cardinalfish
(Nectamia spp.)
(Nectamia spp.)
Unidentified Pempheris Sweeper - Sweeper
(Pempheris sp.)
(Pempheris sp.)
Unidentified Triplefin spp. - Triplefin
(Enneapterygius/Helcogramma/Ucla spp.)
(Enneapterygius/Helcogramma/Ucla spp.)
Wedgetail Triggerfish - Triggerfish
(Rhinecanthus rectangulus)
(Rhinecanthus rectangulus)
Whiteband Damsel - Damselfish
(Plectroglyphidodon leucozonus)
(Plectroglyphidodon leucozonus)
Whitebar Gregory - Damselfish
(Stegastes albifasciatus)
(Stegastes albifasciatus)
Whitecheek Surgeonfish - Surgeonfish
(Acanthurus nigricans)
(Acanthurus nigricans)
Whitepatch Razorfish - Wrasse
(Iniistius aneitensis)
(Iniistius aneitensis)
Yellow-spotted Scorpionfish - Scorpionfish and Lionfish
(Sebastapistes cyanostigma)
(Sebastapistes cyanostigma)
Yellowmargin Moray - Moray
(Gymnothorax flavimarginatus)
(Gymnothorax flavimarginatus)
Yellowskin Pygmygoby - Goby
(Trimma xanthochrum)
(Trimma xanthochrum)
Yellowstripe Goatfish - Goatfish
(Mulloidichthys flavolineatus)
(Mulloidichthys flavolineatus)
Yellowtail Scad - Jack
(Atule mate)
(Atule mate)
Allen's Tubelip - Wrasse
(Labropsis alleni)
(Labropsis alleni)
Barchin Scorpionfish - Scorpionfish and Lionfish
(Sebastapistes strongia)
(Sebastapistes strongia)
Barred Unicornfish - Surgeonfish
(Naso thynnoides)
(Naso thynnoides)
Barred-fin Moray - Moray
(Gymnothorax zonipectis)
(Gymnothorax zonipectis)
Bloch's Bigeye - Bigeye
(Priacanthus blochii)
(Priacanthus blochii)
Brass-striped Barracuda - Barracuda
(Sphyraena stellata)
(Sphyraena stellata)
Chinamanfish - Snapper
(Symphorus nematophorus)
(Symphorus nematophorus)
Coachwhip Trevally - Jack
(Carangoides oblongus)
(Carangoides oblongus)
Convict Reefgoby - Goby
(Priolepis cincta)
(Priolepis cincta)
Delicate Blenny - Blenny
(Glyptoparus delicatulus)
(Glyptoparus delicatulus)
Dwarf Perchlet - Grouper
(Plectranthias nanus)
(Plectranthias nanus)
Ellipse Shrimpgoby - Goby
(Amblyeleotris ellipse)
(Amblyeleotris ellipse)
Exquisite Pygmygoby - Goby
(Trimma preclarum)
(Trimma preclarum)
Fivelined Cardinalfish - Cardinalfish
(Cheilodipterus quinquelineatus)
(Cheilodipterus quinquelineatus)
Foursaddle Grouper - Grouper
(Epinephelus spilotoceps)
(Epinephelus spilotoceps)
Galzin's Garden Eel - Conger and Garden Eel
(Gorgasia galzini)
(Gorgasia galzini)
Golden Angelfish - Angelfish
(Centropyge aurantia)
(Centropyge aurantia)
Goram Dragonet - Dragonet
(Diplogrammus goramensis)
(Diplogrammus goramensis)
Highfin Parrotfish - Parrotfish
(Scarus longipinnis)
(Scarus longipinnis)
Jewelled Blenny - Blenny
(Salarias fasciatus)
(Salarias fasciatus)
Ladder Wrasse - Wrasse
(Thalassoma trilobatum)
(Thalassoma trilobatum)
Largemouth Triplefin - Triplefin
(Ucla xenogrammus)
(Ucla xenogrammus)
Malabar Grouper - Grouper
(Epinephelus malabaricus)
(Epinephelus malabaricus)
Map Puffer - Puffer/Toby
(Arothron mappa)
(Arothron mappa)
Meander Pygmygoby - Goby
(Trimma maiandros)
(Trimma maiandros)
Nai'a Pipefish - Pipefish and Seahorse
(Dunckerocampus naia)
(Dunckerocampus naia)
Nocturn Goby - Goby
(Amblygobius nocturnus)
(Amblygobius nocturnus)
Obscure Damsel - Damselfish
(Pomacentrus adelus)
(Pomacentrus adelus)
Oceanic Triggerfish - Triggerfish
(Canthidermis maculatus)
(Canthidermis maculatus)
Onestripe Wormfish - Wormfish
(Gunnellichthys pleurotaenia)
(Gunnellichthys pleurotaenia)
Orange-spotted Pipefish - Pipefish and Seahorse
(Corythoichthys ocellatus)
(Corythoichthys ocellatus)
Orangespot Cardinalfish - Cardinalfish
(Ostorhinchus rubrimacula)
(Ostorhinchus rubrimacula)
Pyramid Butterflyfish - Butterflyfish
(Hemitaurichthys polylepis)
(Hemitaurichthys polylepis)
Robust Fine-scaled Dottyback - Dottyback
(Lubbockichthys sp (Rob Myers))
(Lubbockichthys sp (Rob Myers))
Roughsnout Ghost Pipefish - Ghost Pipefish
(Solenostomus paegnius)
(Solenostomus paegnius)
Russell's Snapper - Snapper
(Lutjanus russellii)
(Lutjanus russellii)
Samoan Cardinalfish - Cardinalfish
(Nectamia savayensis)
(Nectamia savayensis)
Scaly Damsel - Damselfish
(Pomacentrus lepidogenys)
(Pomacentrus lepidogenys)
Scrawled Filefish - Filefish
(Aluterus scriptus)
(Aluterus scriptus)
Silver Pearlfish - Pearlfish
(Encheliophis homei)
(Encheliophis homei)
Silverstreak Shrimpgoby - Goby
(Ctenogobiops crocineus)
(Ctenogobiops crocineus)
Tailspot Cardinalfish - Cardinalfish
(Ostorhinchus ocellicaudus)
(Ostorhinchus ocellicaudus)
Threespot Cardinalfish - Cardinalfish
(Pristicon trimaculatus)
(Pristicon trimaculatus)
Tomato Grouper - Grouper
(Cephalopholis sonnerati)
(Cephalopholis sonnerati)
Unidentified Fairy Wrasse (Cirrhilabrus sp) - Wrasse
(Cirrhilabrus sp.)
(Cirrhilabrus sp.)
Unidentified Lizardfish spp. - Lizardfish
(Synodus sp. / Saurida sp.)
(Synodus sp. / Saurida sp.)
Unidentified Pipefish (Corythoichthys sp.) - Pipefish and Seahorse
(Corythoichthys sp.)
(Corythoichthys sp.)
Unidentified Pipefish (unknown genus) - Pipefish and Seahorse
(Syngnathidae spp.)
(Syngnathidae spp.)
Unidentified Scad - Jack
(Unidentified Scad sp.)
(Unidentified Scad sp.)
White-spotted Wrasse - Wrasse
(Anampses melanurus)
(Anampses melanurus)
Yellow Coralgoby - Goby
(Gobiodon okinawae)
(Gobiodon okinawae)
Yellow-spotted Trevally - Jack
(Carangoides orthogrammus)
(Carangoides orthogrammus)
Yellowtail Barracuda - Barracuda
(Sphyraena flavicauda)
(Sphyraena flavicauda)
Zebra Lionfish - Scorpionfish and Lionfish
(Dendrochirus zebra)
(Dendrochirus zebra)
Zigzag Wrasse - Wrasse
(Halichoeres scapularis)
(Halichoeres scapularis)