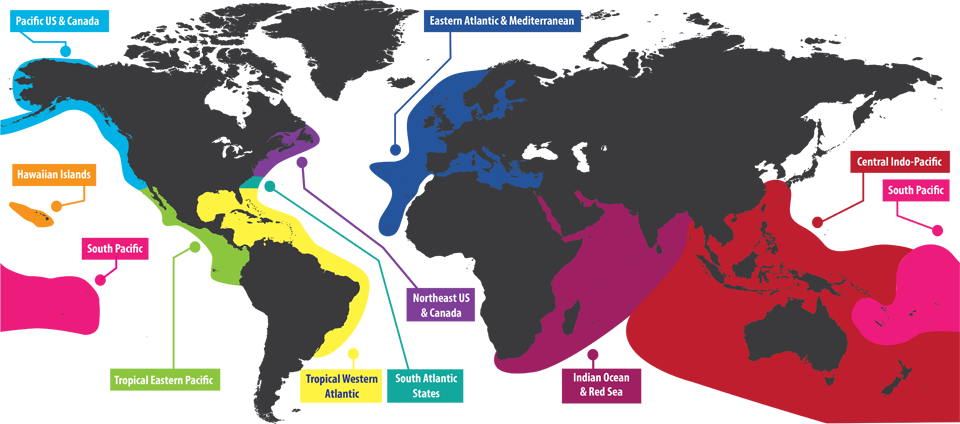
Select a region from the map.
Main menu
- Programs
- Volunteer Fish Survey Project
- Invasive Species Program
- Grouper Moon Project
- Internship and Fellows Programs
- Conservation Science
- REEF Trips
- Ocean Exploration Center
- Plan Your Visit
- Exhibits, Events, & Programs
- About
- Education
- Student Programs
- Educator Resources
- Marine Life ID Resources
- Support
- Support REEF
- Business Support
- Other Ways to Give
- About
- About, Mission, Vision
- REEF Membership
- Staff, Board, & Panels
- News
- Events
- Signature Annual Events
- Upcoming and Ongoing Events
- My REEF
- My Data
- My Profile