Region: NE
All
Survey Types: Fish Only, Invertebrates Only, Fish & Invertebrates
Dates: 1/1/93 - 7/5/26
Total Surveys: 12
#Species Reported: 29
Average Species Reported on a Survey by Expert Surveyors: 0
Average Species Reported on a Survey by Novice Surveyors: 5.83
Survey Type: FO = Fish Only; IO = Invertebrates Only; FI = Fish & Invertebrates - How to interpret REEF data?
Click a column header to sort by that column. Hold shift and click to sort by multiple columns
| Surveys | Bottom Time | |||||||
|---|---|---|---|---|---|---|---|---|
| Expert | Novice | |||||||
| Code | Name | FO | IO | FI | FO | IO | FI | (H:M) |
| 9 | US & CANADA EAST COAST (Newfoundland thru Virginia) | 0 | 0 | 0 | 1 | 5 | 6 | 5:16 |
| 91 | NE US (Maine thru New York/Hudson Canyon) | 0 | 0 | 0 | 1 | 5 | 6 | 5:16 |
| 9101 | Massachusetts | 0 | 0 | 0 | 1 | 5 | 6 | 5:16 |
| 910108 | Massachusetts Bay (n. of Minot - Magnolia) | 0 | 0 | 0 | 1 | 5 | 6 | 5:16 |
| 91010826 | Pumphouse Beach, Nahant | 0 | 0 | 0 | 1 | 5 | 6 | 5:16 |
| TOTALS | 0 | 0 | 0 | 1 | 5 | 6 | 5:16 | |
Species
%SF = Sighting Frequency; DEN = Density Score - How to interpret REEF data?
Bar length corresponds to sighting frequency
Color saturation corresponds to density score
Click + to display species image and additional information.
Bar length corresponds to sighting frequency
Color saturation corresponds to density score
Click + to display species image and additional information.
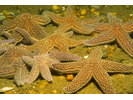
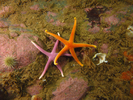
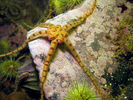
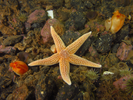
Forbes' Sea Star - Echinoderms
(Asterias forbesi)
(Asterias forbesi)
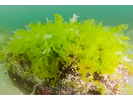
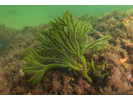
Sea Lettuce - Marine Plants and Algae
(Ulva sp.)
(Ulva sp.)
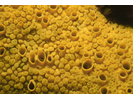
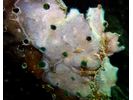
Orange Sheath Tunicate - Urochordates
(Botrylloides violaceus)
(Botrylloides violaceus)

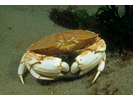
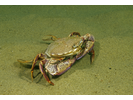
Atlantic Rock Crab - Arthropods
(Cancer irroratus)
(Cancer irroratus)

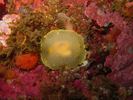
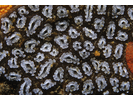
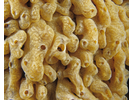
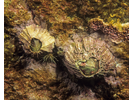
Boring Sponge - Poriferans
(Cliona celata)
(Cliona celata)
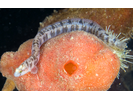
Rock Gunnel - Gunnel
(Pholis gunnellus)
(Pholis gunnellus)
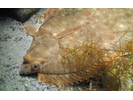
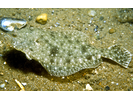
Winter Flounder - Flounder (Right-Eye)
(Pseudopleuronectes americanus)
(Pseudopleuronectes americanus)
Blood Star - Echinoderms
(Henricia sanguinolenta)
(Henricia sanguinolenta)
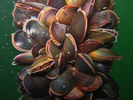
Blue Mussel - Mollusks
(Mytilus edulis)
(Mytilus edulis)
Jonah Crab - Arthropods
(Cancer borealis)
(Cancer borealis)
Club Tunicate - Urochordates
(Styela clava)
(Styela clava)
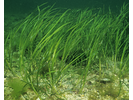
Eel Grass - Marine Plants and Algae
(Zostera marina)
(Zostera marina)
Golden Star Tunicate - Urochordates
(Botryllus schlosseri)
(Botryllus schlosseri)
Green Fleece - Marine Plants and Algae
(Codium fragile)
(Codium fragile)
Invasive Didemnum Tunicate - Urochordates
(Didemnum vexillum)
(Didemnum vexillum)
Sea Lace - Bryozoans
(Membranipora membranacea)
(Membranipora membranacea)
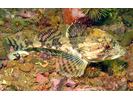
Longhorn Sculpin - Marine Sculpin
(Myoxocephalus octodecemspinosus)
(Myoxocephalus octodecemspinosus)
Summer Flounder - Flounder
(Paralichthys dentatus)
(Paralichthys dentatus)
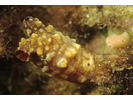
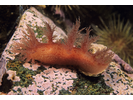
Bushy-Backed Nudibranch - Mollusks
(Dendronotus frondosus)
(Dendronotus frondosus)
Daisy Brittle Star - Echinoderms
(Ophiopholis aculeata)
(Ophiopholis aculeata)
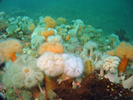
Frilled Anemone - Cnidarians
(Metridium senile)
(Metridium senile)
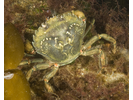
Green Crab - Arthropods
(Carcinus maenus)
(Carcinus maenus)
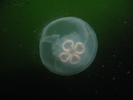
Moon Jelly - Cnidarians
(Aurelia aurita)
(Aurelia aurita)
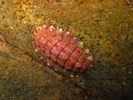
Mottled Chiton / Red Chiton - Mollusks
(Tonicella sp.)
(Tonicella sp.)
Northern Sea Star - Echinoderms
(Asterias rubens)
(Asterias rubens)
Ocellate Lady Crab - Arthropods
(Ovalipes ocellatus)
(Ovalipes ocellatus)
Rough Barnacle - Arthropods
(Balanus balanus)
(Balanus balanus)
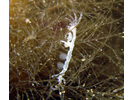
Skeleton Shrimp - Arthropods
(Caprella sp.)
(Caprella sp.)
White Cadlina / Yellow Cadlina - Mollusks
(Cadlina laevis / Cadlina luteomarginata)
(Cadlina laevis / Cadlina luteomarginata)