Region: NE
All
Survey Types: Fish Only, Invertebrates Only, Fish & Invertebrates
Dates: 1/1/93 - 8/3/26
Total Surveys: 1
#Species Reported: 5
Average Species Reported on a Survey by Expert Surveyors: 0
Average Species Reported on a Survey by Novice Surveyors: 5.00
Survey Type: FO = Fish Only; IO = Invertebrates Only; FI = Fish & Invertebrates - How to interpret REEF data?
Click a column header to sort by that column. Hold shift and click to sort by multiple columns
| Surveys | Bottom Time | |||||||
|---|---|---|---|---|---|---|---|---|
| Expert | Novice | |||||||
| Code | Name | FO | IO | FI | FO | IO | FI | (H:M) |
| 9 | US & CANADA EAST COAST (Newfoundland thru Virginia) | 0 | 0 | 0 | 1 | 0 | 0 | 0:33 |
| 91 | NE US (Maine thru New York/Hudson Canyon) | 0 | 0 | 0 | 1 | 0 | 0 | 0:33 |
| 9105 | Connecticut | 0 | 0 | 0 | 1 | 0 | 0 | 0:33 |
| 910501 | Belle Haven - Stratford Light | 0 | 0 | 0 | 1 | 0 | 0 | 0:33 |
| TOTALS | 0 | 0 | 0 | 1 | 0 | 0 | 0:33 | |
Species
%SF = Sighting Frequency; DEN = Density Score - How to interpret REEF data?
Bar length corresponds to sighting frequency
Color saturation corresponds to density score
Click + to display species image and additional information.
Bar length corresponds to sighting frequency
Color saturation corresponds to density score
Click + to display species image and additional information.
Butterfish - Butterfishes
(Peprilus triacanthus)
(Peprilus triacanthus)
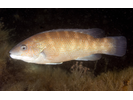
Cunner - Wrasse
(Tautogolabrus adspersus)
(Tautogolabrus adspersus)
Grubby Sculpin - Marine Sculpin
(Myoxocephalus aenaeus)
(Myoxocephalus aenaeus)

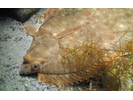
Summer Flounder - Flounder
(Paralichthys dentatus)
(Paralichthys dentatus)
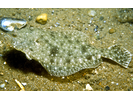
Winter Flounder - Flounder (Right-Eye)
(Pseudopleuronectes americanus)
(Pseudopleuronectes americanus)