Region: PAC
All
Survey Types: Fish Only, Invertebrates Only, Fish & Invertebrates
Dates: 1/1/93 - 3/24/26
Total Surveys: 1
#Species Reported: 32
Average Species Reported on a Survey by Expert Surveyors: 32.00
Average Species Reported on a Survey by Novice Surveyors: 0
Survey Type: FO = Fish Only; IO = Invertebrates Only; FI = Fish & Invertebrates - How to interpret REEF data?
Click a column header to sort by that column. Hold shift and click to sort by multiple columns
| Surveys | Bottom Time | |||||||
|---|---|---|---|---|---|---|---|---|
| Expert | Novice | |||||||
| Code | Name | FO | IO | FI | FO | IO | FI | (H:M) |
| 4 | California | 0 | 0 | 1 | 0 | 0 | 0 | 0:45 |
| 42 | SOUTHERN CALIFORNIA | 0 | 0 | 1 | 0 | 0 | 0 | 0:45 |
| 4203 | Southern Channel Islands | 0 | 0 | 1 | 0 | 0 | 0 | 0:45 |
| 420304 | San Clemente Island | 0 | 0 | 1 | 0 | 0 | 0 | 0:45 |
| 42030427 | Nosc Pier South | 0 | 0 | 1 | 0 | 0 | 0 | 0:45 |
| TOTALS | 0 | 0 | 1 | 0 | 0 | 0 | 0:45 | |
Species
%SF = Sighting Frequency; DEN = Density Score - How to interpret REEF data?
Bar length corresponds to sighting frequency
Color saturation corresponds to density score
Click + to display species image and additional information.
Bar length corresponds to sighting frequency
Color saturation corresponds to density score
Click + to display species image and additional information.
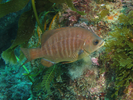
Black Perch - Surfperch
(Embiotoca jacksoni)
(Embiotoca jacksoni)
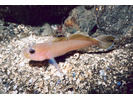
Blackeye Goby - Goby
(Rhinogobiops nicholsii)
(Rhinogobiops nicholsii)
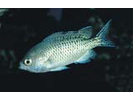
Blacksmith - Damselfish
(Chromis punctipinnis)
(Chromis punctipinnis)
Bluebanded Goby - Goby
(Lythrypnus dalli)
(Lythrypnus dalli)
Brown Gorgonian - Cnidarians
(Muricea fruticosa)
(Muricea fruticosa)
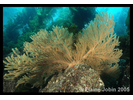
California Golden Gorgonian - Cnidarians
(Muricea californica)
(Muricea californica)
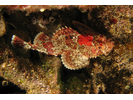
California Scorpionfish - Scorpionfish
(Scorpaena guttata)
(Scorpaena guttata)
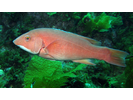
California Sheephead - Wrasse
(Bodianus pulcher)
(Bodianus pulcher)
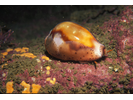
Chestnut Cowry - Mollusks
(Cypraea spadicea)
(Cypraea spadicea)
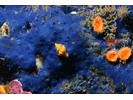
Cobalt Sponge - Poriferans
(Hymenamphiastra cyanocrypta)
(Hymenamphiastra cyanocrypta)
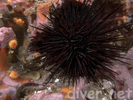
Crowned Urchin - Echinoderms
(Centrostphanus coronatus)
(Centrostphanus coronatus)
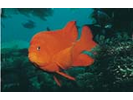
Garibaldi - Damselfish
(Hypsypops rubicundus)
(Hypsypops rubicundus)
Giant Kelp - Algae
(Macrocystis integrifolia / pyrifera)
(Macrocystis integrifolia / pyrifera)

Giant Keyhole Limpet - Mollusks
(Megathura crenulata)
(Megathura crenulata)
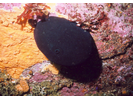
Green Abalone - Mollusks
(Haliotis fulgens)
(Haliotis fulgens)
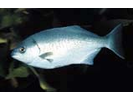
Halfmoon - Sea Chub
(Medialuna californiensis)
(Medialuna californiensis)
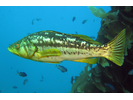
Kelp Bass - Sea Bass
(Paralabrax clathratus)
(Paralabrax clathratus)
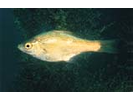
Kelp Perch - Surfperch
(Brachyistius frenatus)
(Brachyistius frenatus)
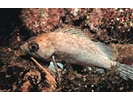
Kelp Rockfish - Scorpionfish
(Sebastes atrovirens)
(Sebastes atrovirens)
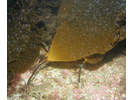
Oarweed - Algae
(Laminaria farlowii)
(Laminaria farlowii)
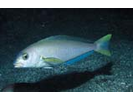
Ocean Whitefish - Tilefish
(Caulolatilus princeps)
(Caulolatilus princeps)
Opaleye - Sea Chub
(Girella nigricans)
(Girella nigricans)
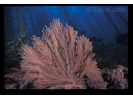
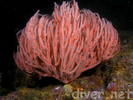
Red Gorgonian - Cnidarians
(Leptogorgia chilensis)
(Leptogorgia chilensis)
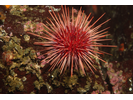
Red Sea Urchin - Echinoderms
(Mesocentrotus franciscanus)
(Mesocentrotus franciscanus)
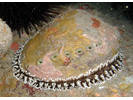
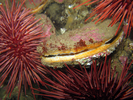
Rock Scallop - Mollusks
(Crassadoma gigantea)
(Crassadoma gigantea)
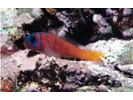
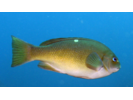
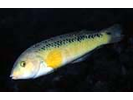
Rock Wrasse - Wrasse
(Halichoeres semicinctus)
(Halichoeres semicinctus)
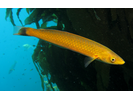
Senorita - Wrasse
(Oxyjulis californica)
(Oxyjulis californica)
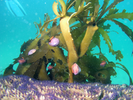
Southern Sea Palm - Algae
(Eisenia arborea)
(Eisenia arborea)
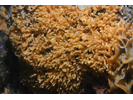
Southern Staghorn Bryozoan - Bryozoans
(Diaperoforma californica)
(Diaperoforma californica)
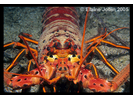
Spiny Lobster - Arthropods
(Panulirus interruptus)
(Panulirus interruptus)
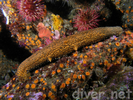
Warty Sea Cucumber - Echinoderms
(Parastichopus parvimensis)
(Parastichopus parvimensis)
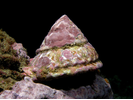
Wavy Turban Snail - Mollusks
(Lithopoma undosum)
(Lithopoma undosum)