Region: PAC
All
Survey Types: Fish Only, Invertebrates Only, Fish & Invertebrates
Dates: 1/1/93 - 7/17/26
Total Surveys: 1
#Species Reported: 28
Average Species Reported on a Survey by Expert Surveyors: 28.00
Average Species Reported on a Survey by Novice Surveyors: 0
Survey Type: FO = Fish Only; IO = Invertebrates Only; FI = Fish & Invertebrates - How to interpret REEF data?
Click a column header to sort by that column. Hold shift and click to sort by multiple columns
| Surveys | Bottom Time | |||||||
|---|---|---|---|---|---|---|---|---|
| Expert | Novice | |||||||
| Code | Name | FO | IO | FI | FO | IO | FI | (H:M) |
| 1 | British Columbia | 0 | 0 | 1 | 0 | 0 | 0 | 0:31 |
| 11 | Queen Charlotte Strait | 0 | 0 | 1 | 0 | 0 | 0 | 0:31 |
| 112 | North of Chatham Point - Telegraph Cove (Johnstone Strait) | 0 | 0 | 1 | 0 | 0 | 0 | 0:31 |
| 112010 | Telegraph Cove area and Plumper Islands | 0 | 0 | 1 | 0 | 0 | 0 | 0:31 |
| 11201012 | Ella Bay (Telegraph Cove area) | 0 | 0 | 1 | 0 | 0 | 0 | 0:31 |
| TOTALS | 0 | 0 | 1 | 0 | 0 | 0 | 0:31 | |
Species
%SF = Sighting Frequency; DEN = Density Score - How to interpret REEF data?
Bar length corresponds to sighting frequency
Color saturation corresponds to density score
Click + to display species image and additional information.
Bar length corresponds to sighting frequency
Color saturation corresponds to density score
Click + to display species image and additional information.
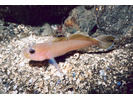
Blackeye Goby - Goby
(Rhinogobiops nicholsii)
(Rhinogobiops nicholsii)
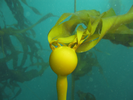
Bull Kelp - Algae
(Nereocystis luetkeana)
(Nereocystis luetkeana)
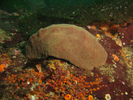
California Sea Cucumber - Echinoderms
(Parastichopus californicus)
(Parastichopus californicus)
Cloud/Goblet Sponge - Poriferans
(Aphrocallistes vastus / Heterochone calyx)
(Aphrocallistes vastus / Heterochone calyx)

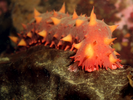
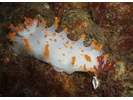
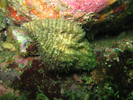
Clown Dorid - Mollusks
(Triopha modesta / Triopha catalinae)
(Triopha modesta / Triopha catalinae)
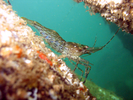
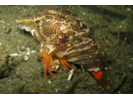
Coonstripe Shrimp - Arthropods
(Pandalus danae / gurneyi)
(Pandalus danae / gurneyi)
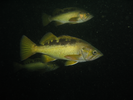
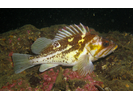
Copper Rockfish - Scorpionfish
(Sebastes caurinus)
(Sebastes caurinus)
Giant Barnacle - Arthropods
(Balanus nubilus)
(Balanus nubilus)
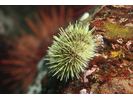
Green Sea Urchin - Echinoderms
(Strongylocentrotus droebachiensis)
(Strongylocentrotus droebachiensis)
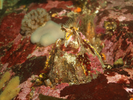
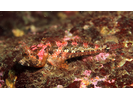
Grunt Sculpin - Grunt Sculpins
(Rhamphocottus richardsonii)
(Rhamphocottus richardsonii)
Gumboot Chiton - Mollusks
(Cryptochiton stelleri)
(Cryptochiton stelleri)
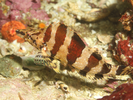
Kelp Greenling - Greenling
(Hexagrammos decagrammus)
(Hexagrammos decagrammus)
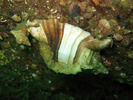
Leafy Hornmouth - Mollusks
(Ceratostoma foliatum)
(Ceratostoma foliatum)
Longfin Gunnel - Gunnel
(Pholis clemensi)
(Pholis clemensi)

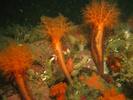
Orange Sea Cucumber - Echinoderms
(Cucumaria miniata)
(Cucumaria miniata)
Orange Zoanthid - Cnidarians
(Epizoanthus scotinus)
(Epizoanthus scotinus)
Oregon Triton - Mollusks
(Fusitriton oregonensis)
(Fusitriton oregonensis)
Painted Greenling - Greenling
(Oxylebius pictus)
(Oxylebius pictus)
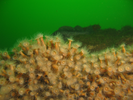
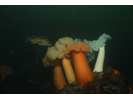
Plumose Anemone - Cnidarians
(Metridium farcimen / senile)
(Metridium farcimen / senile)
Puget Sound Rockfish - Scorpionfish
(Sebastes emphaeus)
(Sebastes emphaeus)

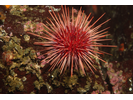
Red Sea Urchin - Echinoderms
(Mesocentrotus franciscanus)
(Mesocentrotus franciscanus)
Scalyhead Sculpin - Marine Sculpins
(Artedius harringtoni)
(Artedius harringtoni)
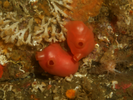
Shiny Orange Sea Squirt - Urochordates
(Cnemidocarpa finmarkiensis)
(Cnemidocarpa finmarkiensis)
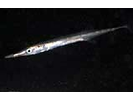
Tubesnout - Tubesnout
(Aulorhynchus flavidus)
(Aulorhynchus flavidus)
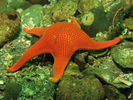
Vermilion Star - Echinoderms
(Mediaster aequalis)
(Mediaster aequalis)
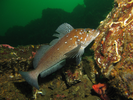
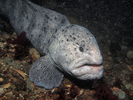
Wolf-eel - Wolffish
(Anarrhichthys ocellatus)
(Anarrhichthys ocellatus)
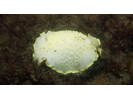
Yellow Margin Dorid Complex - Mollusks
(Cadlina luteomarginata/sylviaearleae/klasmalmbergi/jannanicholsae/Acanthodoris hudsoni)
(Cadlina luteomarginata/sylviaearleae/klasmalmbergi/jannanicholsae/Acanthodoris hudsoni)
Yellowtail Rockfish - Scorpionfish
(Sebastes flavidus)
(Sebastes flavidus)