Region: PAC
All
Survey Types: Fish Only, Invertebrates Only, Fish & Invertebrates
Dates: 1/1/93 - 7/5/26
Total Surveys: 7
#Species Reported: 20
Average Species Reported on a Survey by Expert Surveyors: 6.00
Average Species Reported on a Survey by Novice Surveyors: 7.00
Survey Type: FO = Fish Only; IO = Invertebrates Only; FI = Fish & Invertebrates - How to interpret REEF data?
Click a column header to sort by that column. Hold shift and click to sort by multiple columns
| Surveys | Bottom Time | |||||||
|---|---|---|---|---|---|---|---|---|
| Expert | Novice | |||||||
| Code | Name | FO | IO | FI | FO | IO | FI | (H:M) |
| 3 | Oregon | 0 | 0 | 3 | 0 | 1 | 3 | 5:42 |
| 32 | SOUTH BEACH - NORTH BEND | 0 | 0 | 3 | 0 | 1 | 3 | 5:42 |
| 3201 | Newport - Waldport | 0 | 0 | 3 | 0 | 1 | 3 | 5:42 |
| 320101 | Yaquina Bay | 0 | 0 | 3 | 0 | 1 | 3 | 5:42 |
| 32010103 | Crab Dock, Yaquina Bay | 0 | 0 | 3 | 0 | 1 | 3 | 5:42 |
| TOTALS | 0 | 0 | 3 | 0 | 1 | 3 | 5:42 | |
Species
%SF = Sighting Frequency; DEN = Density Score - How to interpret REEF data?
Bar length corresponds to sighting frequency
Color saturation corresponds to density score
Click + to display species image and additional information.
Bar length corresponds to sighting frequency
Color saturation corresponds to density score
Click + to display species image and additional information.
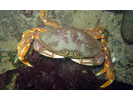
Dungeness Crab - Arthropods
(Metacarcinus magister)
(Metacarcinus magister)
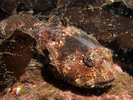
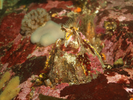
Buffalo Sculpin - Marine Sculpins
(Enophrys bison)
(Enophrys bison)
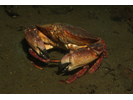
Red Rock Crab - Arthropods
(Cancer productus)
(Cancer productus)
Spiny Pink Star - Echinoderms
(Pisaster brevispinus)
(Pisaster brevispinus)

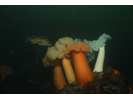
Plumose Anemone - Cnidarians
(Metridium farcimen / senile)
(Metridium farcimen / senile)
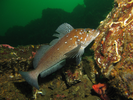
Whitespotted Greenling - Greenling
(Hexagrammos stelleri)
(Hexagrammos stelleri)
Juvenile (YOY) Rockfish - Unidentified - Scorpionfish
(Sebastes sp. (YOY))
(Sebastes sp. (YOY))

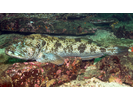
Kelp Greenling - Greenling
(Hexagrammos decagrammus)
(Hexagrammos decagrammus)
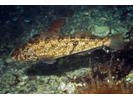
Lingcod - Greenling
(Ophiodon elongatus)
(Ophiodon elongatus)
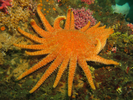
Sunflower Star - Echinoderms
(Pycnopodia helianthoides)
(Pycnopodia helianthoides)
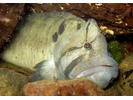
Cabezon - Longfin Sculpins
(Scorpaenichthys marmoratus)
(Scorpaenichthys marmoratus)

Monkeyface Prickleback - Prickleback
(Cebidichthys violaceus)
(Cebidichthys violaceus)
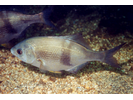
Pile Perch - Surfperch
(Rhacochilus vacca)
(Rhacochilus vacca)
Speckled Sanddab - Sand Flounder
(Citharichthys stigmaeus)
(Citharichthys stigmaeus)

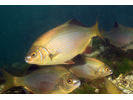
Striped Seaperch - Surfperch
(Embiotoca lateralis)
(Embiotoca lateralis)
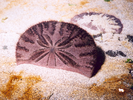
Eccentric Sand Dollar - Echinoderms
(Dendraster excentricus)
(Dendraster excentricus)
Giant Barnacle - Arthropods
(Balanus nubilus)
(Balanus nubilus)
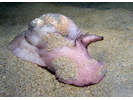
Lewis' Moonsnail - Mollusks
(Neverita lewisii)
(Neverita lewisii)
Northern Feather Duster Worm - Annelids
(Eudistylia vancouveri)
(Eudistylia vancouveri)
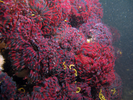
Strawberry Anemone - Cnidarians
(Corynactis californica)
(Corynactis californica)
