Region: PAC
All
Survey Types: Fish Only, Invertebrates Only, Fish & Invertebrates
Dates: 1/1/93 - 6/28/26
Total Surveys: 6
#Species Reported: 41
Average Species Reported on a Survey by Expert Surveyors: 18.00
Average Species Reported on a Survey by Novice Surveyors: 21.00
Survey Type: FO = Fish Only; IO = Invertebrates Only; FI = Fish & Invertebrates - How to interpret REEF data?
Click a column header to sort by that column. Hold shift and click to sort by multiple columns
| Surveys | Bottom Time | |||||||
|---|---|---|---|---|---|---|---|---|
| Expert | Novice | |||||||
| Code | Name | FO | IO | FI | FO | IO | FI | (H:M) |
| 3 | Oregon | 0 | 0 | 1 | 0 | 0 | 5 | 4:28 |
| 32 | SOUTH BEACH - NORTH BEND | 0 | 0 | 1 | 0 | 0 | 5 | 4:28 |
| 3201 | Newport - Waldport | 0 | 0 | 1 | 0 | 0 | 5 | 4:28 |
| 320101 | Yaquina Bay | 0 | 0 | 1 | 0 | 0 | 5 | 4:28 |
| 32010109 | Johnson Rock | 0 | 0 | 1 | 0 | 0 | 5 | 4:28 |
| TOTALS | 0 | 0 | 1 | 0 | 0 | 5 | 4:28 | |
Species
%SF = Sighting Frequency; DEN = Density Score - How to interpret REEF data?
Bar length corresponds to sighting frequency
Color saturation corresponds to density score
Click + to display species image and additional information.
Bar length corresponds to sighting frequency
Color saturation corresponds to density score
Click + to display species image and additional information.
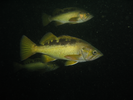
Black Rockfish - Scorpionfish
(Sebastes melanops)
(Sebastes melanops)
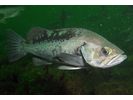
Blue Rockfish - generic ID - Scorpionfish
(Sebastes mystinus/diaconus)
(Sebastes mystinus/diaconus)

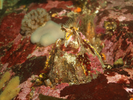
Giant Barnacle - Arthropods
(Balanus nubilus)
(Balanus nubilus)
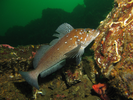
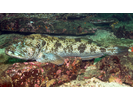
Kelp Greenling - Greenling
(Hexagrammos decagrammus)
(Hexagrammos decagrammus)
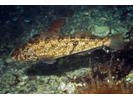
Lingcod - Greenling
(Ophiodon elongatus)
(Ophiodon elongatus)
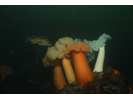
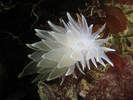
Plumose Anemone - Cnidarians
(Metridium farcimen / senile)
(Metridium farcimen / senile)
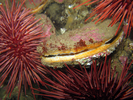
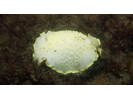
Rock Scallop - Mollusks
(Crassadoma gigantea)
(Crassadoma gigantea)
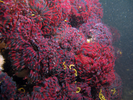
Strawberry Anemone - Cnidarians
(Corynactis californica)
(Corynactis californica)

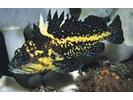
Cabezon - Longfin Sculpins
(Scorpaenichthys marmoratus)
(Scorpaenichthys marmoratus)

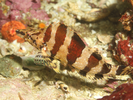
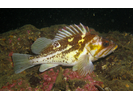
China Rockfish - Scorpionfish
(Sebastes nebulosus)
(Sebastes nebulosus)
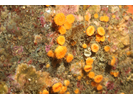
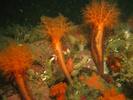
Orange Cup Coral - Cnidarians
(Balanophyllia elegans)
(Balanophyllia elegans)
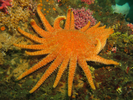
Sunflower Star - Echinoderms
(Pycnopodia helianthoides)
(Pycnopodia helianthoides)
Juvenile (YOY) Rockfish - Unidentified - Scorpionfish
(Sebastes sp. (YOY))
(Sebastes sp. (YOY))

Leather Star - Echinoderms
(Dermasterias imbricata)
(Dermasterias imbricata)
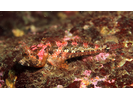
Red Irish Lord - Marine Sculpins
(Hemilepidotus hemilepidotus)
(Hemilepidotus hemilepidotus)
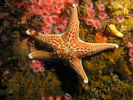
Spiny Pink Star - Echinoderms
(Pisaster brevispinus)
(Pisaster brevispinus)

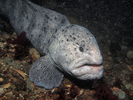
Wolf-eel - Wolffish
(Anarrhichthys ocellatus)
(Anarrhichthys ocellatus)
Opalescent Nudibranch - Mollusks
(Hermissenda crassicornis / opalescens)
(Hermissenda crassicornis / opalescens)

Whitespotted Greenling - Greenling
(Hexagrammos stelleri)
(Hexagrammos stelleri)
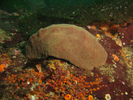
California Sea Cucumber - Echinoderms
(Parastichopus californicus)
(Parastichopus californicus)
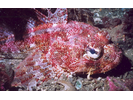
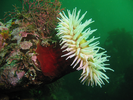
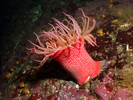
Fish-eating Anemone - Cnidarians
(Urticina piscivora)
(Urticina piscivora)
Gumboot Chiton - Mollusks
(Cryptochiton stelleri)
(Cryptochiton stelleri)
Painted Greenling - Greenling
(Oxylebius pictus)
(Oxylebius pictus)
Scalyhead Sculpin - Marine Sculpins
(Artedius harringtoni)
(Artedius harringtoni)
White-lined Dirona - Mollusks
(Dirona albolineata)
(Dirona albolineata)
White-spotted Anemone - Cnidarians
(Urticina sp.)
(Urticina sp.)
Blue Rockfish (was Blue-blotched species) - Scorpionfish
(Sebastes mystinus)
(Sebastes mystinus)
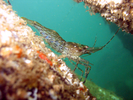
Coonstripe Shrimp - Arthropods
(Pandalus danae / gurneyi)
(Pandalus danae / gurneyi)
Copper Rockfish - Scorpionfish
(Sebastes caurinus)
(Sebastes caurinus)
Crescent Gunnel - Gunnel
(Pholis laeta)
(Pholis laeta)

Fringed Tube Worm - Annelids
(Dodecaceria pacifica)
(Dodecaceria pacifica)

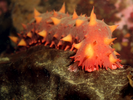
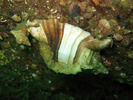
Leafy Hornmouth - Mollusks
(Ceratostoma foliatum)
(Ceratostoma foliatum)
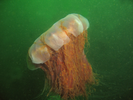
Lion's Mane Jelly - Cnidarians
(Cyanea capillata)
(Cyanea capillata)
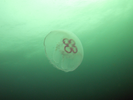
Moon Jelly - Cnidarians
(Aurelia labiata)
(Aurelia labiata)
Northern Feather Duster Worm - Annelids
(Eudistylia vancouveri)
(Eudistylia vancouveri)
Orange Sea Cucumber - Echinoderms
(Cucumaria miniata)
(Cucumaria miniata)
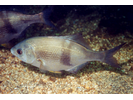
Pile Perch - Surfperch
(Rhacochilus vacca)
(Rhacochilus vacca)
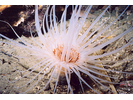
Tube-dwelling Anemone - Cnidarians
(Pachycerianthus fimbriatus)
(Pachycerianthus fimbriatus)
Unidentified Sculpin - Marine Sculpins
(Psychrolutidae spp.)
(Psychrolutidae spp.)
Yellow Margin Dorid Complex - Mollusks
(Cadlina luteomarginata/sylviaearleae/klasmalmbergi/jannanicholsae/Acanthodoris hudsoni)
(Cadlina luteomarginata/sylviaearleae/klasmalmbergi/jannanicholsae/Acanthodoris hudsoni)
Yellowtail Rockfish - Scorpionfish
(Sebastes flavidus)
(Sebastes flavidus)