Region: PAC
All
Survey Types: Fish Only, Invertebrates Only, Fish & Invertebrates
Dates: 1/1/93 - 7/4/26
Total Surveys: 2
#Species Reported: 14
Average Species Reported on a Survey by Expert Surveyors: 9.00
Average Species Reported on a Survey by Novice Surveyors: 5.00
Survey Type: FO = Fish Only; IO = Invertebrates Only; FI = Fish & Invertebrates - How to interpret REEF data?
Click a column header to sort by that column. Hold shift and click to sort by multiple columns
| Surveys | Bottom Time | |||||||
|---|---|---|---|---|---|---|---|---|
| Expert | Novice | |||||||
| Code | Name | FO | IO | FI | FO | IO | FI | (H:M) |
| 4 | California | 1 | 0 | 0 | 1 | 0 | 0 | 1:48 |
| 42 | SOUTHERN CALIFORNIA | 1 | 0 | 0 | 1 | 0 | 0 | 1:48 |
| 4201 | S Point Conception - N Point Heuneme | 1 | 0 | 0 | 1 | 0 | 0 | 1:48 |
| 4201026 | Carpenteria | 1 | 0 | 0 | 1 | 0 | 0 | 1:48 |
| 42010261 | Platform Holly (3 miles offshore) | 1 | 0 | 0 | 1 | 0 | 0 | 1:48 |
| TOTALS | 1 | 0 | 0 | 1 | 0 | 0 | 1:48 | |
Species
%SF = Sighting Frequency; DEN = Density Score - How to interpret REEF data?
Bar length corresponds to sighting frequency
Color saturation corresponds to density score
Click + to display species image and additional information.
Bar length corresponds to sighting frequency
Color saturation corresponds to density score
Click + to display species image and additional information.
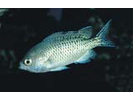
Blacksmith - Damselfish
(Chromis punctipinnis)
(Chromis punctipinnis)
Blue Rockfish - generic ID - Scorpionfish
(Sebastes mystinus/diaconus)
(Sebastes mystinus/diaconus)

Cabezon - Longfin Sculpins
(Scorpaenichthys marmoratus)
(Scorpaenichthys marmoratus)

Giant Kelpfish - Clinid
(Heterostichus rostratus)
(Heterostichus rostratus)
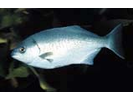
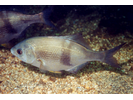
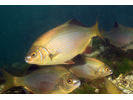
Halfmoon - Sea Chub
(Medialuna californiensis)
(Medialuna californiensis)
Juvenile (YOY) Rockfish - Unidentified - Scorpionfish
(Sebastes sp. (YOY))
(Sebastes sp. (YOY))

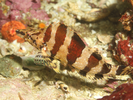
Kelp Rockfish - Scorpionfish
(Sebastes atrovirens)
(Sebastes atrovirens)
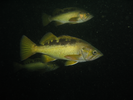
Olive Rockfish - Scorpionfish
(Sebastes serranoides)
(Sebastes serranoides)
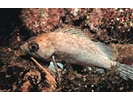
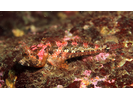
Painted Greenling - Greenling
(Oxylebius pictus)
(Oxylebius pictus)
Pile Perch - Surfperch
(Rhacochilus vacca)
(Rhacochilus vacca)
Scalyhead Sculpin - Marine Sculpins
(Artedius harringtoni)
(Artedius harringtoni)
Striped Seaperch - Surfperch
(Embiotoca lateralis)
(Embiotoca lateralis)
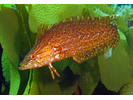
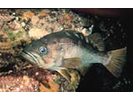
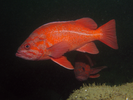
Vermilion Rockfish - Scorpionfish
(Sebastes miniatus)
(Sebastes miniatus)
Yellowtail Rockfish - Scorpionfish
(Sebastes flavidus)
(Sebastes flavidus)