Region: PAC
All
Survey Types: Fish Only, Invertebrates Only, Fish & Invertebrates
Dates: 1/1/93 - 6/21/26
Total Surveys: 1
#Species Reported: 39
Average Species Reported on a Survey by Expert Surveyors: 39.00
Average Species Reported on a Survey by Novice Surveyors: 0
Survey Type: FO = Fish Only; IO = Invertebrates Only; FI = Fish & Invertebrates - How to interpret REEF data?
Click a column header to sort by that column. Hold shift and click to sort by multiple columns
| Surveys | Bottom Time | |||||||
|---|---|---|---|---|---|---|---|---|
| Expert | Novice | |||||||
| Code | Name | FO | IO | FI | FO | IO | FI | (H:M) |
| 4 | California | 0 | 0 | 1 | 0 | 0 | 0 | 0:48 |
| 42 | SOUTHERN CALIFORNIA | 0 | 0 | 1 | 0 | 0 | 0 | 0:48 |
| 4207 | S La Jolla - Tijuana | 0 | 0 | 1 | 0 | 0 | 0 | 0:48 |
| 420702 | Point Loma | 0 | 0 | 1 | 0 | 0 | 0 | 0:48 |
| 42070253 | Tic Tac Toe Plateau | 0 | 0 | 1 | 0 | 0 | 0 | 0:48 |
| TOTALS | 0 | 0 | 1 | 0 | 0 | 0 | 0:48 | |
Species
%SF = Sighting Frequency; DEN = Density Score - How to interpret REEF data?
Bar length corresponds to sighting frequency
Color saturation corresponds to density score
Click + to display species image and additional information.
Bar length corresponds to sighting frequency
Color saturation corresponds to density score
Click + to display species image and additional information.
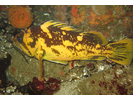
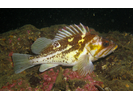
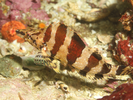
Black-and-Yellow Rockfish - Scorpionfish
(Sebastes chrysomelas)
(Sebastes chrysomelas)
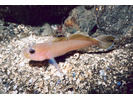
Blackeye Goby - Goby
(Rhinogobiops nicholsii)
(Rhinogobiops nicholsii)
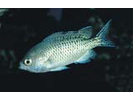
Blacksmith - Damselfish
(Chromis punctipinnis)
(Chromis punctipinnis)
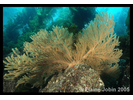
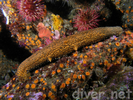
California Golden Gorgonian - Cnidarians
(Muricea californica)
(Muricea californica)
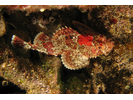
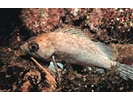
California Scorpionfish - Scorpionfish
(Scorpaena guttata)
(Scorpaena guttata)
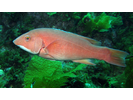
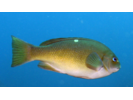
California Sheephead - Wrasse
(Bodianus pulcher)
(Bodianus pulcher)
Cobalt Sponge - Poriferans
(Hymenamphiastra cyanocrypta)
(Hymenamphiastra cyanocrypta)
Copper Rockfish - Scorpionfish
(Sebastes caurinus)
(Sebastes caurinus)
Crowned Urchin - Echinoderms
(Centrostphanus coronatus)
(Centrostphanus coronatus)
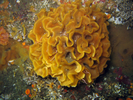
Fluted Bryozoan - Bryozoans
(Primavelans insculpta)
(Primavelans insculpta)
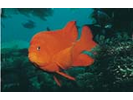
Garibaldi - Damselfish
(Hypsypops rubicundus)
(Hypsypops rubicundus)
Giant Kelp - Algae
(Macrocystis integrifolia / pyrifera)
(Macrocystis integrifolia / pyrifera)

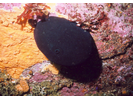
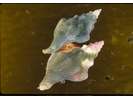
Giant Keyhole Limpet - Mollusks
(Megathura crenulata)
(Megathura crenulata)
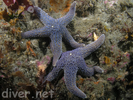
Giant Spined Star - Echinoderms
(Pisaster giganteus)
(Pisaster giganteus)
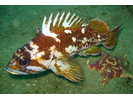
Gopher Rockfish - Scorpionfish
(Sebastes carnatus)
(Sebastes carnatus)
Grass Rockfish - Scorpionfish
(Sebastes rastrelliger)
(Sebastes rastrelliger)

Kellet's Whelk - Mollusks
(Kelletia kelletii)
(Kelletia kelletii)
Kelp Bass - Sea Bass
(Paralabrax clathratus)
(Paralabrax clathratus)
Kelp Rockfish - Scorpionfish
(Sebastes atrovirens)
(Sebastes atrovirens)
Lacy Bryozoan - Bryozoans
(Phidolopora pacifica)
(Phidolopora pacifica)

Opaleye - Sea Chub
(Girella nigricans)
(Girella nigricans)
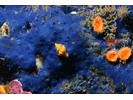
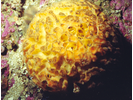
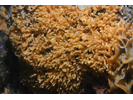
Orange Puffball Sponge - Poriferans
(Tethya aurantia)
(Tethya aurantia)
Painted Greenling - Greenling
(Oxylebius pictus)
(Oxylebius pictus)
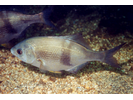
Pile Perch - Surfperch
(Rhacochilus vacca)
(Rhacochilus vacca)
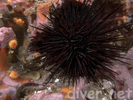
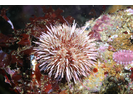
Purple Urchin - Echinoderms
(Strongylocentrotus purpuratus)
(Strongylocentrotus purpuratus)
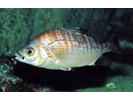
Rainbow Seaperch - Surfperch
(Hypsurus caryi)
(Hypsurus caryi)
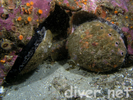
Red Abalone - Mollusks
(Haliotis rufescens)
(Haliotis rufescens)
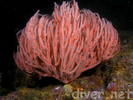
Red Gorgonian - Cnidarians
(Leptogorgia chilensis)
(Leptogorgia chilensis)
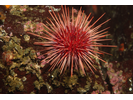
Red Sea Urchin - Echinoderms
(Mesocentrotus franciscanus)
(Mesocentrotus franciscanus)
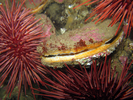
Rock Scallop - Mollusks
(Crassadoma gigantea)
(Crassadoma gigantea)
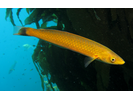
Senorita - Wrasse
(Oxyjulis californica)
(Oxyjulis californica)
Southern Staghorn Bryozoan - Bryozoans
(Diaperoforma californica)
(Diaperoforma californica)
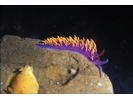
Spanish Shawl - Mollusks
(Flabellina iodinea)
(Flabellina iodinea)
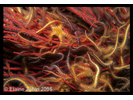
Spiny Brittlestar - Echinoderms
(Ophiothrix spiculata)
(Ophiothrix spiculata)
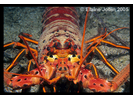
Spiny Lobster - Arthropods
(Panulirus interruptus)
(Panulirus interruptus)
Strawberry Anemone - Cnidarians
(Corynactis californica)
(Corynactis californica)

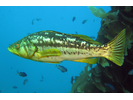
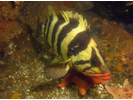
Treefish - Scorpionfish
(Sebastes serriceps)
(Sebastes serriceps)
Warty Sea Cucumber - Echinoderms
(Parastichopus parvimensis)
(Parastichopus parvimensis)
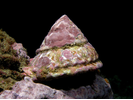
Wavy Turban Snail - Mollusks
(Lithopoma undosum)
(Lithopoma undosum)