Region: TWA
All
Survey Types: Species & Abundance, Species Only
Dates: 1/1/93 - 6/23/26
Total Surveys: 4
#Species Reported: 28
Average Species Reported on a Survey by Expert Surveyors: 17.00
Average Species Reported on a Survey by Novice Surveyors: 13.00
Survey Type: SA = Species & Abundance; SO = Species Only - How to interpret REEF data?
Click a column header to sort by that column. Hold shift and click to sort by multiple columns
| Surveys | Bottom Time | |||||
|---|---|---|---|---|---|---|
| Expert | Novice | |||||
| Code | Name | SA | SO | SA | SO | (H:M) |
| 2 | GULF OF MEXICO (Cape Sable to Yucatan Cabo Catoche | 3 | 0 | 1 | 0 | 3:09 |
| 23 | SOUTH EAST (Cape Sable to Tampa Bay) | 3 | 0 | 1 | 0 | 3:09 |
| 2301 | Clearwater & Pinellas County | 3 | 0 | 1 | 0 | 3:09 |
| 23010004 | 3 Mile Ledge | 3 | 0 | 1 | 0 | 3:09 |
| TOTALS | 3 | 0 | 1 | 0 | 3:09 | |
Species
%SF = Sighting Frequency; DEN = Density Score - How to interpret REEF data?
Bar length corresponds to sighting frequency
Color saturation corresponds to density score
Click + to display species image and additional information.
Bar length corresponds to sighting frequency
Color saturation corresponds to density score
Click + to display species image and additional information.
Belted Sandfish - Seabass
(Serranus subligarius)
(Serranus subligarius)
Cubbyu - Drum
(Pareques umbrosus)
(Pareques umbrosus)

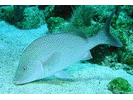
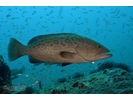
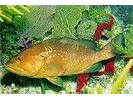
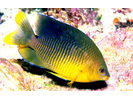
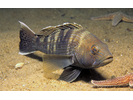
Gag - Seabass
(Mycteroperca microlepis)
(Mycteroperca microlepis)
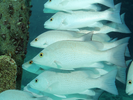
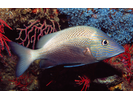
Gray Snapper - Snapper
(Lutjanus griseus)
(Lutjanus griseus)
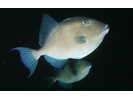
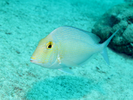
Gray Triggerfish - Triggerfish
(Balistes capriscus)
(Balistes capriscus)
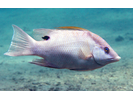
Sheepshead - Porgy
(Archosargus probatocephalus)
(Archosargus probatocephalus)
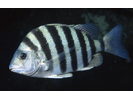
White Grunt - Grunt
(Haemulon plumierii)
(Haemulon plumierii)
Hogfish - Wrasse
(Lachnolaimus maximus)
(Lachnolaimus maximus)
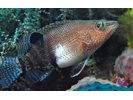
Red Grouper - Seabass
(Epinephelus morio)
(Epinephelus morio)
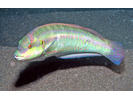
Slippery Dick - Wrasse
(Halichoeres bivittatus)
(Halichoeres bivittatus)
Tiger Goby - Goby
(Gobiosoma macrodon)
(Gobiosoma macrodon)
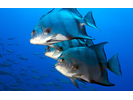
Atlantic Spadefish - Spadefish
(Chaetodipterus faber)
(Chaetodipterus faber)
Cocoa Damselfish - Damselfish
(Stegastes xanthurus)
(Stegastes xanthurus)
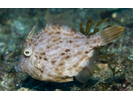
Planehead Filefish - Filefish
(Stephanolepis hispida)
(Stephanolepis hispida)
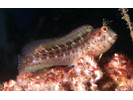
Sand Diver - Lizardfish
(Synodus intermedius)
(Synodus intermedius)

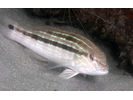
Sand Perch - Seabass
(Diplectrum formosum)
(Diplectrum formosum)
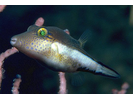
Scrawled Cowfish - Boxfish
(Acanthostracion quadricornis)
(Acanthostracion quadricornis)

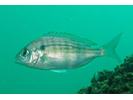
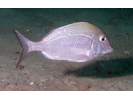
Spottail Pinfish - Porgy
(Diplodus holbrookii)
(Diplodus holbrookii)

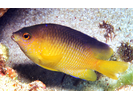
Beaugregory - Damselfish
(Stegastes leucostictus)
(Stegastes leucostictus)
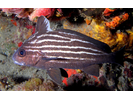
Black Sea Bass - Seabass
(Centropristis striata)
(Centropristis striata)
Highhat - Drum
(Pareques acuminatus / Pareques lineatus)
(Pareques acuminatus / Pareques lineatus)
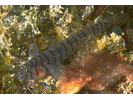
Leopard Toadfish - Toadfish
(Opsanus pardus)
(Opsanus pardus)
Pinfish - Porgy
(Lagodon rhomboides)
(Lagodon rhomboides)
Saucereye Porgy - Porgy
(Calamus calamus)
(Calamus calamus)
Seaweed Blenny - Blenny - Combtooth
(Parablennius marmoreus)
(Parablennius marmoreus)
Sharpnose Puffer - Puffer
(Canthigaster rostrata)
(Canthigaster rostrata)
Sheepshead Porgy - Porgy
(Calamus penna)
(Calamus penna)
White Margate - Grunt
(Haemulon album)
(Haemulon album)