Region: TWA
All
Survey Types: Species & Abundance, Species Only
Dates: 1/1/93 - 6/16/26
Total Surveys: 5
#Species Reported: 98
Average Species Reported on a Survey by Expert Surveyors: 58.60
Average Species Reported on a Survey by Novice Surveyors: 0
Survey Type: SA = Species & Abundance; SO = Species Only - How to interpret REEF data?
Click a column header to sort by that column. Hold shift and click to sort by multiple columns
| Surveys | Bottom Time | |||||
|---|---|---|---|---|---|---|
| Expert | Novice | |||||
| Code | Name | SA | SO | SA | SO | (H:M) |
| 3 | FLORIDA (East Coast and Keys) | 5 | 0 | 0 | 0 | 3:47 |
| 33 | EAST COAST SOUTH (Jupiter Inlet to Key Biscayne) | 5 | 0 | 0 | 0 | 3:47 |
| 3301 | Jupiter Inlet to Key Biscayne | 5 | 0 | 0 | 0 | 3:47 |
| 33010240 | Sloan's Curve | 5 | 0 | 0 | 0 | 3:47 |
| TOTALS | 5 | 0 | 0 | 0 | 3:47 | |
Species
%SF = Sighting Frequency; DEN = Density Score - How to interpret REEF data?
Bar length corresponds to sighting frequency
Color saturation corresponds to density score
Click + to display species image and additional information.
Bar length corresponds to sighting frequency
Color saturation corresponds to density score
Click + to display species image and additional information.
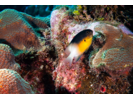
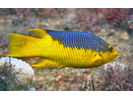
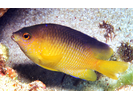
Bicolor Damselfish - Damselfish
(Stegastes partitus)
(Stegastes partitus)
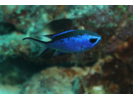
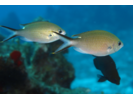
Blue Chromis - Damselfish
(Azurina cyanea)
(Azurina cyanea)
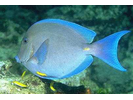
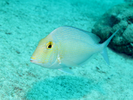
Blue Tang - Surgeonfish
(Acanthurus coeruleus)
(Acanthurus coeruleus)
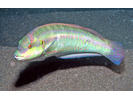
Bluehead - Wrasse
(Thalassoma bifasciatum)
(Thalassoma bifasciatum)
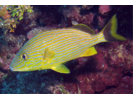
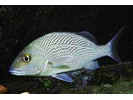
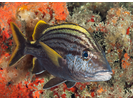
Bluestriped Grunt - Grunt
(Haemulon sciurus)
(Haemulon sciurus)
Butter Hamlet - Seabass
(Hypoplectrus unicolor)
(Hypoplectrus unicolor)
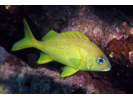
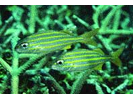
Caesar Grunt - Grunt
(Haemulon carbonarium)
(Haemulon carbonarium)
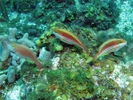
Creole Wrasse - Wrasse
(Bodianus parrae)
(Bodianus parrae)

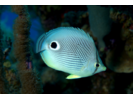
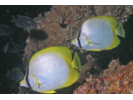
Foureye Butterflyfish - Butterflyfish
(Chaetodon capistratus)
(Chaetodon capistratus)
French Grunt - Grunt
(Haemulon flavolineatum)
(Haemulon flavolineatum)
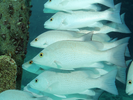
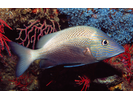
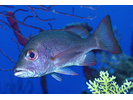
Gray Snapper - Snapper
(Lutjanus griseus)
(Lutjanus griseus)
Graysby - Seabass
(Cephalopholis cruentata)
(Cephalopholis cruentata)

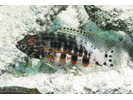
Harlequin Bass - Seabass
(Serranus tigrinus)
(Serranus tigrinus)

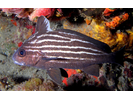
Highhat - Drum
(Pareques acuminatus / Pareques lineatus)
(Pareques acuminatus / Pareques lineatus)
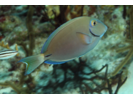
Ocean Surgeonfish - Surgeonfish
(Acanthurus tractus)
(Acanthurus tractus)
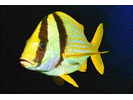
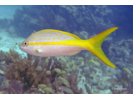
Porkfish - Grunt
(Anisotremus virginicus)
(Anisotremus virginicus)
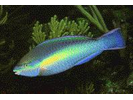
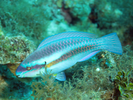
Princess Parrotfish - Parrotfish
(Scarus taeniopterus)
(Scarus taeniopterus)
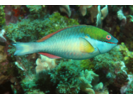
Redband Parrotfish - Parrotfish
(Sparisoma aurofrenatum)
(Sparisoma aurofrenatum)
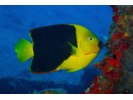
Rock Beauty - Angelfish
(Holacanthus tricolor)
(Holacanthus tricolor)
Sailors Choice - Grunt
(Haemulon parra)
(Haemulon parra)
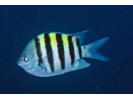
Sergeant Major - Damselfish
(Abudefduf saxatilis)
(Abudefduf saxatilis)
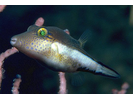
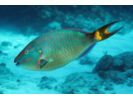
Sharpnose Puffer - Puffer
(Canthigaster rostrata)
(Canthigaster rostrata)
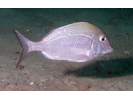
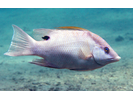
Sheepshead Porgy - Porgy
(Calamus penna)
(Calamus penna)
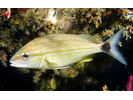
Smallmouth Grunt - Grunt
(Haemulon chrysargyreum)
(Haemulon chrysargyreum)
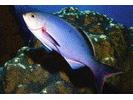
Spanish Hogfish - Wrasse
(Bodianus rufus)
(Bodianus rufus)
Spotfin Butterflyfish - Butterflyfish
(Chaetodon ocellatus)
(Chaetodon ocellatus)
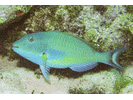
Stoplight Parrotfish - Parrotfish
(Sparisoma viride)
(Sparisoma viride)
Striped Parrotfish - Parrotfish
(Scarus iseri)
(Scarus iseri)
Tomtate - Grunt
(Haemulon aurolineatum)
(Haemulon aurolineatum)
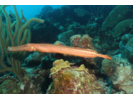
Trumpetfish - Trumpetfish
(Aulostomus maculatus)
(Aulostomus maculatus)
White Grunt - Grunt
(Haemulon plumierii)
(Haemulon plumierii)
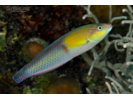
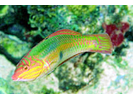
Yellowhead Wrasse - Wrasse
(Halichoeres garnoti)
(Halichoeres garnoti)
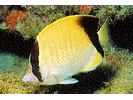
Blue Angelfish - Angelfish
(Holacanthus bermudensis)
(Holacanthus bermudensis)
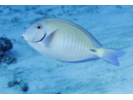
Doctorfish - Surgeonfish
(Acanthurus chirurgus)
(Acanthurus chirurgus)
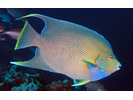
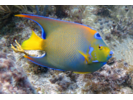
Queen Angelfish - Angelfish
(Holacanthus ciliaris)
(Holacanthus ciliaris)
Reef Butterflyfish - Butterflyfish
(Chaetodon sedentarius)
(Chaetodon sedentarius)
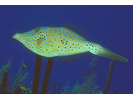
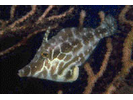
Scrawled Filefish - Filefish
(Aluterus scriptus)
(Aluterus scriptus)
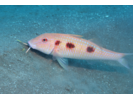
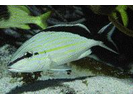
Spotted Goatfish - Goatfish
(Pseudupeneus maculatus)
(Pseudupeneus maculatus)
Yellowtail Snapper - Snapper
(Ocyurus chrysurus)
(Ocyurus chrysurus)
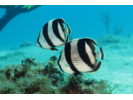
Banded Butterflyfish - Butterflyfish
(Chaetodon striatus)
(Chaetodon striatus)
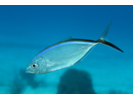
Bar Jack - Jack
(Caranx ruber)
(Caranx ruber)
Beaugregory - Damselfish
(Stegastes leucostictus)
(Stegastes leucostictus)
Black Margate - Grunt
(Anisotremus surinamensis)
(Anisotremus surinamensis)

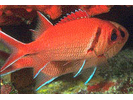
Blackbar Soldierfish - Squirrelfish
(Myripristis jacobus)
(Myripristis jacobus)
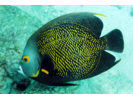
French Angelfish - Angelfish
(Pomacanthus paru)
(Pomacanthus paru)
Gray Angelfish - Angelfish
(Pomacanthus arcuatus)
(Pomacanthus arcuatus)

Honeycomb Cowfish - Boxfish
(Acanthostracion polygonius)
(Acanthostracion polygonius)
Lane Snapper - Snapper
(Lutjanus synagris)
(Lutjanus synagris)

Mahogany Snapper - Snapper
(Lutjanus mahogoni)
(Lutjanus mahogoni)
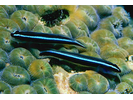
Neon Goby - Goby
(Elacatinus oceanops)
(Elacatinus oceanops)
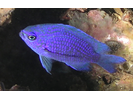
Purple Reeffish - Damselfish
(Chromis scotti)
(Chromis scotti)
Redtail Parrotfish - Parrotfish
(Sparisoma chrysopterum)
(Sparisoma chrysopterum)
Squirrelfish - Squirrelfish
(Holocentrus adscensionis)
(Holocentrus adscensionis)

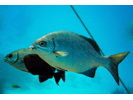
Bermuda Chub/Gray Chub - Chub
(Kyphosus sectatrix / K. bigibbus)
(Kyphosus sectatrix / K. bigibbus)
Brown Chromis - Damselfish
(Azurina multilineata)
(Azurina multilineata)
Clown Wrasse - Wrasse
(Halichoeres maculipinna)
(Halichoeres maculipinna)
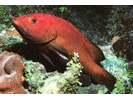
Coney - Seabass
(Cephalopholis fulva)
(Cephalopholis fulva)
Cottonwick - Grunt
(Haemulon melanurum)
(Haemulon melanurum)
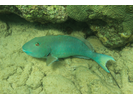
Hogfish - Wrasse
(Lachnolaimus maximus)
(Lachnolaimus maximus)
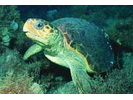
Loggerhead Sea Turtle - Sea Turtles
(Caretta caretta)
(Caretta caretta)
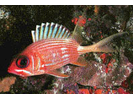
Longspine Squirrelfish - Squirrelfish
(Holocentrus rufus)
(Holocentrus rufus)
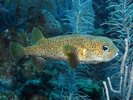
Porcupinefish - Porcupinefish
(Diodon hystrix)
(Diodon hystrix)
Saucereye Porgy - Porgy
(Calamus calamus)
(Calamus calamus)
Scrawled Cowfish - Boxfish
(Acanthostracion quadricornis)
(Acanthostracion quadricornis)

Slippery Dick - Wrasse
(Halichoeres bivittatus)
(Halichoeres bivittatus)
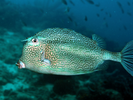
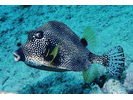
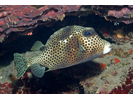
Smooth Trunkfish - Boxfish
(Lactophrys triqueter)
(Lactophrys triqueter)
Spanish Grunt - Grunt
(Haemulon macrostoma)
(Haemulon macrostoma)
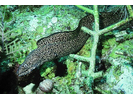
Spotted Moray - Moray
(Gymnothorax moringa)
(Gymnothorax moringa)
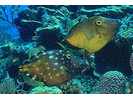
Whitespotted Filefish - Filefish
(Cantherhines macrocerus)
(Cantherhines macrocerus)
Yellow Stingray - Round Stingrays
(Urobatis jamaicensis)
(Urobatis jamaicensis)
Yellowtail (Redfin) Parrotfish - Parrotfish
(Sparisoma rubripinne)
(Sparisoma rubripinne)
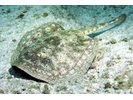
Atlantic Guitarfish - Guitarfish
(Rhinobatos lentiginosus)
(Rhinobatos lentiginosus)
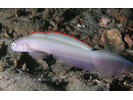
Blue Dartfish (Blue Goby) - Dartfish
(Ptereleotris calliurus)
(Ptereleotris calliurus)
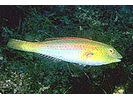
Bluelip Parrotfish - Parrotfish
(Cryptotomus roseus)
(Cryptotomus roseus)
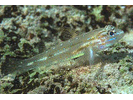
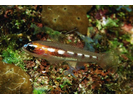
Bridled Goby Complex (Bridled/Sand-Canyon/Patch-Reef) - Goby
(C. glaucofraenum/C. venezuelae/C. tortugae)
(C. glaucofraenum/C. venezuelae/C. tortugae)
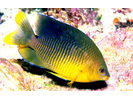
Cocoa Damselfish - Damselfish
(Stegastes xanthurus)
(Stegastes xanthurus)
Creolefish (Atlantic) - Seabass
(Paranthias furcifer)
(Paranthias furcifer)
Cubbyu - Drum
(Pareques umbrosus)
(Pareques umbrosus)

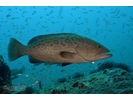
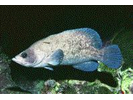
Gag - Seabass
(Mycteroperca microlepis)
(Mycteroperca microlepis)
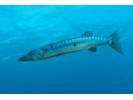
Great Barracuda - Barracuda
(Sphyraena barracuda)
(Sphyraena barracuda)
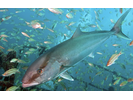
Greater Amberjack - Jack
(Seriola dumerili)
(Seriola dumerili)
Greater Soapfish - Soapfishes
(Rypticus saponaceus)
(Rypticus saponaceus)
Greenblotch Parrotfish - Parrotfish
(Sparisoma atomarium)
(Sparisoma atomarium)
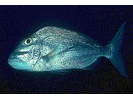
Jolthead Porgy - Porgy
(Calamus bajonado)
(Calamus bajonado)
Lantern Bass - Seabass
(Serranus baldwini)
(Serranus baldwini)
Masked Goby/Glass Goby - Goby
(Coryphopterus personatus/hyalinus)
(Coryphopterus personatus/hyalinus)
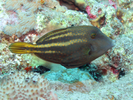
Orangespotted Filefish - Filefish
(Cantherhines pullus)
(Cantherhines pullus)
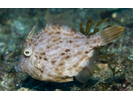
Planehead Filefish - Filefish
(Stephanolepis hispida)
(Stephanolepis hispida)
Polka-dot Batfish - Batfish
(Ogcocephalus cubifrons)
(Ogcocephalus cubifrons)
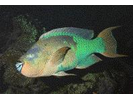
Rainbow Parrotfish - Parrotfish
(Scarus guacamaia)
(Scarus guacamaia)
Sand Tilefish - Tilefish
(Malacanthus plumieri)
(Malacanthus plumieri)

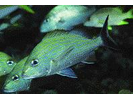
Schoolmaster - Snapper
(Lutjanus apodus)
(Lutjanus apodus)
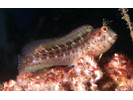
Seaweed Blenny - Blenny - Combtooth
(Parablennius marmoreus)
(Parablennius marmoreus)
Slender Filefish - Filefish
(Monacanthus tuckeri)
(Monacanthus tuckeri)
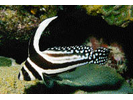
Spotted Drum - Drum
(Eques punctatus)
(Eques punctatus)
Spotted Trunkfish - Boxfish
(Lactophrys bicaudalis)
(Lactophrys bicaudalis)
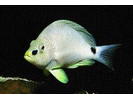
Sunshinefish - Damselfish
(Chromis insolata)
(Chromis insolata)

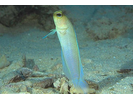
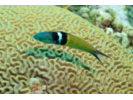
Yellowhead Jawfish - Jawfish
(Opistognathus aurifrons)
(Opistognathus aurifrons)