Region: TWA
All
Survey Types: Species & Abundance, Species Only
Dates: 1/1/93 - 7/27/26
Total Surveys: 5
#Species Reported: 82
Average Species Reported on a Survey by Expert Surveyors: 55.50
Average Species Reported on a Survey by Novice Surveyors: 38.33
Survey Type: SA = Species & Abundance; SO = Species Only - How to interpret REEF data?
Click a column header to sort by that column. Hold shift and click to sort by multiple columns
| Surveys | Bottom Time | |||||
|---|---|---|---|---|---|---|
| Expert | Novice | |||||
| Code | Name | SA | SO | SA | SO | (H:M) |
| 3 | FLORIDA (East Coast and Keys) | 2 | 0 | 3 | 0 | 3:10 |
| 33 | EAST COAST SOUTH (Jupiter Inlet to Key Biscayne) | 2 | 0 | 3 | 0 | 3:10 |
| 3302 | Biscayne National Park | 2 | 0 | 3 | 0 | 3:10 |
| 330202 | Biscayne Monitoring (60') | 2 | 0 | 3 | 0 | 3:10 |
| 33020233 | Bisc W13 | 2 | 0 | 3 | 0 | 3:10 |
| TOTALS | 2 | 0 | 3 | 0 | 3:10 | |
Species
%SF = Sighting Frequency; DEN = Density Score - How to interpret REEF data?
Bar length corresponds to sighting frequency
Color saturation corresponds to density score
Click + to display species image and additional information.
Bar length corresponds to sighting frequency
Color saturation corresponds to density score
Click + to display species image and additional information.
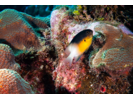
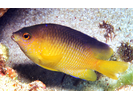
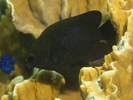
Bicolor Damselfish - Damselfish
(Stegastes partitus)
(Stegastes partitus)
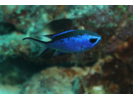
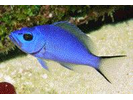
Blue Chromis - Damselfish
(Azurina cyanea)
(Azurina cyanea)
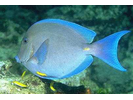
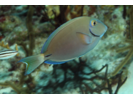
Blue Tang - Surgeonfish
(Acanthurus coeruleus)
(Acanthurus coeruleus)
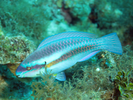
Bluehead - Wrasse
(Thalassoma bifasciatum)
(Thalassoma bifasciatum)
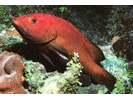
Coney - Seabass
(Cephalopholis fulva)
(Cephalopholis fulva)
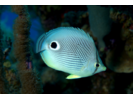
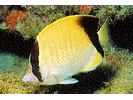
Foureye Butterflyfish - Butterflyfish
(Chaetodon capistratus)
(Chaetodon capistratus)
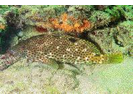
Graysby - Seabass
(Cephalopholis cruentata)
(Cephalopholis cruentata)

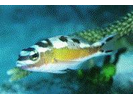
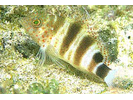
Harlequin Bass - Seabass
(Serranus tigrinus)
(Serranus tigrinus)

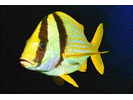
Porkfish - Grunt
(Anisotremus virginicus)
(Anisotremus virginicus)
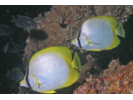
Reef Butterflyfish - Butterflyfish
(Chaetodon sedentarius)
(Chaetodon sedentarius)
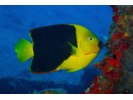
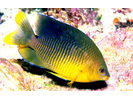
Rock Beauty - Angelfish
(Holacanthus tricolor)
(Holacanthus tricolor)
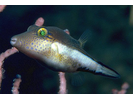
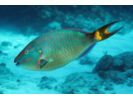
Sharpnose Puffer - Puffer
(Canthigaster rostrata)
(Canthigaster rostrata)
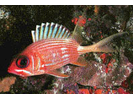
Squirrelfish - Squirrelfish
(Holocentrus adscensionis)
(Holocentrus adscensionis)

White Grunt - Grunt
(Haemulon plumierii)
(Haemulon plumierii)
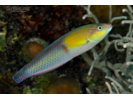
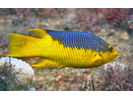
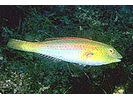
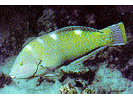
Yellowhead Wrasse - Wrasse
(Halichoeres garnoti)
(Halichoeres garnoti)
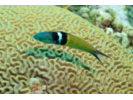
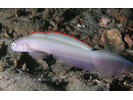
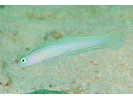
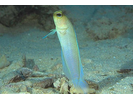
Blue Dartfish (Blue Goby) - Dartfish
(Ptereleotris calliurus)
(Ptereleotris calliurus)
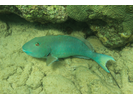
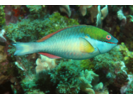
Blue Parrotfish - Parrotfish
(Scarus coeruleus)
(Scarus coeruleus)

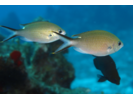
Brown Chromis - Damselfish
(Azurina multilineata)
(Azurina multilineata)
Butter Hamlet - Seabass
(Hypoplectrus unicolor)
(Hypoplectrus unicolor)
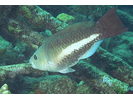
Cocoa Damselfish - Damselfish
(Stegastes xanthurus)
(Stegastes xanthurus)
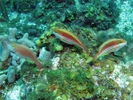
Creole Wrasse - Wrasse
(Bodianus parrae)
(Bodianus parrae)

Doctorfish - Surgeonfish
(Acanthurus chirurgus)
(Acanthurus chirurgus)
Gray Angelfish - Angelfish
(Pomacanthus arcuatus)
(Pomacanthus arcuatus)

Hogfish - Wrasse
(Lachnolaimus maximus)
(Lachnolaimus maximus)
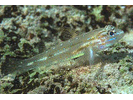
Masked Goby/Glass Goby - Goby
(Coryphopterus personatus/hyalinus)
(Coryphopterus personatus/hyalinus)
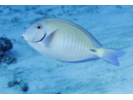
Ocean Surgeonfish - Surgeonfish
(Acanthurus tractus)
(Acanthurus tractus)
Pallid Goby - Goby
(Coryphopterus eidolon)
(Coryphopterus eidolon)
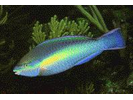
Princess Parrotfish - Parrotfish
(Scarus taeniopterus)
(Scarus taeniopterus)
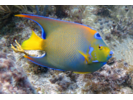
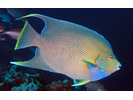
Queen Angelfish - Angelfish
(Holacanthus ciliaris)
(Holacanthus ciliaris)
Redband Parrotfish - Parrotfish
(Sparisoma aurofrenatum)
(Sparisoma aurofrenatum)
Spanish Hogfish - Wrasse
(Bodianus rufus)
(Bodianus rufus)
Spotfin Butterflyfish - Butterflyfish
(Chaetodon ocellatus)
(Chaetodon ocellatus)
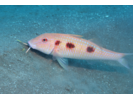
Spotted Goatfish - Goatfish
(Pseudupeneus maculatus)
(Pseudupeneus maculatus)
Striped Parrotfish - Parrotfish
(Scarus iseri)
(Scarus iseri)
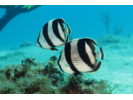
Banded Butterflyfish - Butterflyfish
(Chaetodon striatus)
(Chaetodon striatus)
Blue Angelfish - Angelfish
(Holacanthus bermudensis)
(Holacanthus bermudensis)
Bluelip Parrotfish - Parrotfish
(Cryptotomus roseus)
(Cryptotomus roseus)
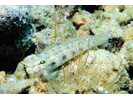
Bridled Goby Complex (Bridled/Sand-Canyon/Patch-Reef) - Goby
(C. glaucofraenum/C. venezuelae/C. tortugae)
(C. glaucofraenum/C. venezuelae/C. tortugae)
Goldspot Goby - Goby
(Gnatholepis thompsoni)
(Gnatholepis thompsoni)
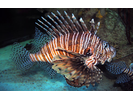
Red Lionfish (exotic) - Scorpionfish
(Pterois volitans)
(Pterois volitans)
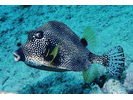
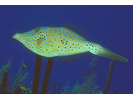
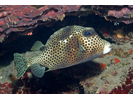
Smooth Trunkfish - Boxfish
(Lactophrys triqueter)
(Lactophrys triqueter)
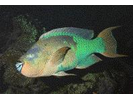
Stoplight Parrotfish - Parrotfish
(Sparisoma viride)
(Sparisoma viride)
Atlantic Spadefish - Spadefish
(Chaetodipterus faber)
(Chaetodipterus faber)
Beaugregory - Damselfish
(Stegastes leucostictus)
(Stegastes leucostictus)
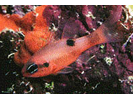
Flamefish - Cardinalfish
(Apogon maculatus)
(Apogon maculatus)
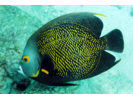
French Angelfish - Angelfish
(Pomacanthus paru)
(Pomacanthus paru)
Longspine Squirrelfish - Squirrelfish
(Holocentrus rufus)
(Holocentrus rufus)
Queen Parrotfish - Parrotfish
(Scarus vetula)
(Scarus vetula)
Scrawled Cowfish - Boxfish
(Acanthostracion quadricornis)
(Acanthostracion quadricornis)

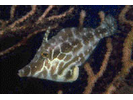
Scrawled Filefish - Filefish
(Aluterus scriptus)
(Aluterus scriptus)
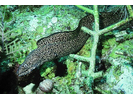
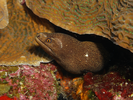
Spotted Moray - Moray
(Gymnothorax moringa)
(Gymnothorax moringa)
Tobaccofish - Seabass
(Serranus tabacarius)
(Serranus tabacarius)
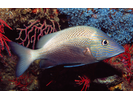
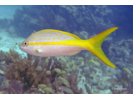
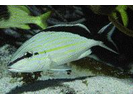
Yellowtail Snapper - Snapper
(Ocyurus chrysurus)
(Ocyurus chrysurus)
Blue Hamlet - Seabass
(Hypoplectrus gemma)
(Hypoplectrus gemma)
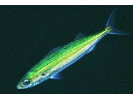
Bonnetmouth - Grunt
(Emmelichthyops atlanticus)
(Emmelichthyops atlanticus)
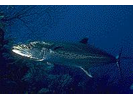
Cero - Mackerel
(Scomberomorus regalis)
(Scomberomorus regalis)
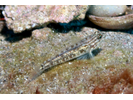
Colon Goby - Goby
(Coryphopterus dicrus)
(Coryphopterus dicrus)
Cottonwick - Grunt
(Haemulon melanurum)
(Haemulon melanurum)
Goldentail Moray - Moray
(Gymnothorax miliaris)
(Gymnothorax miliaris)
Greenblotch Parrotfish - Parrotfish
(Sparisoma atomarium)
(Sparisoma atomarium)
Hovering Dartfish (Hovering Goby) - Dartfish
(Ptereleotris helenae)
(Ptereleotris helenae)
Juvenile Grunt - Grunt
(Haemulon sp.)
(Haemulon sp.)
Longfin Damselfish - Damselfish
(Stegastes diencaeus)
(Stegastes diencaeus)
Mutton Snapper - Snapper
(Lutjanus analis)
(Lutjanus analis)
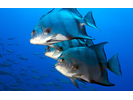
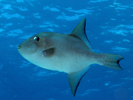
Ocean Triggerfish - Triggerfish
(Canthidermis sufflamen)
(Canthidermis sufflamen)
Puddingwife - Wrasse
(Halichoeres radiatus)
(Halichoeres radiatus)
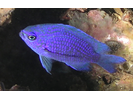
Purple Reeffish - Damselfish
(Chromis scotti)
(Chromis scotti)
Rainbow Parrotfish - Parrotfish
(Scarus guacamaia)
(Scarus guacamaia)
Redspotted Hawkfish - Hawkfish
(Amblycirrhitus pinos)
(Amblycirrhitus pinos)
Rock Hind - Seabass
(Epinephelus adscensionis)
(Epinephelus adscensionis)
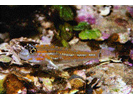
Sand Diver - Lizardfish
(Synodus intermedius)
(Synodus intermedius)

Sand Tilefish - Tilefish
(Malacanthus plumieri)
(Malacanthus plumieri)

Slender Filefish - Filefish
(Monacanthus tuckeri)
(Monacanthus tuckeri)
Spotted Scorpionfish - Scorpionfish
(Scorpaena plumieri plumieri)
(Scorpaena plumieri plumieri)
Spotted Trunkfish - Boxfish
(Lactophrys bicaudalis)
(Lactophrys bicaudalis)
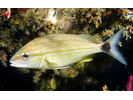
Striped Grunt - Grunt
(Haemulon striatum)
(Haemulon striatum)
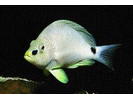
Sunshinefish - Damselfish
(Chromis insolata)
(Chromis insolata)

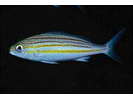
Tomtate - Grunt
(Haemulon aurolineatum)
(Haemulon aurolineatum)
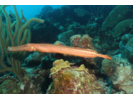
Trumpetfish - Trumpetfish
(Aulostomus maculatus)
(Aulostomus maculatus)
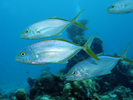
Yellow Jack - Jack
(Caranx bartholomaei)
(Caranx bartholomaei)
Yellowhead Jawfish - Jawfish
(Opistognathus aurifrons)
(Opistognathus aurifrons)
Yellowtail (Redfin) Parrotfish - Parrotfish
(Sparisoma rubripinne)
(Sparisoma rubripinne)