Dates: 7/5/26 - 7/11/26
Region: TWA
Led by: Brian Slopey
Surveyors: Ada Allen, Alek Crocker, Charlie Elmer, Colin McIntyre, Eleanor Geier, Keira Oneil , Langden Ball, Moxie Skelton, Reilly Gerhard, Tessa Seiffert and Toby-o Muller-moore
Total Surveys: 44
#Species Reported: 70
Survey Type: SA = Species & Abundance; SO = Species Only - How to interpret REEF data?
Click a column header to sort by that column. Hold shift and click to sort by multiple columns
| Surveys | Bottom Time | |||||
|---|---|---|---|---|---|---|
| Expert | Novice | |||||
| Code | Name | SA | SO | SA | SO | (H:M) |
| 1 | BERMUDA | 0 | 0 | 44 | 0 | 33:40 |
| 11 | Bermuda | 0 | 0 | 44 | 0 | 33:40 |
| 1101 | Bermuda | 0 | 0 | 44 | 0 | 33:40 |
| 11010 | Bermuda Non-BREAM Sites | 0 | 0 | 41 | 0 | 31:10 |
| 11010015 | Whalebone Bay | 0 | 0 | 4 | 0 | 3:05 |
| 11010018 | North Rock | 0 | 0 | 8 | 0 | 5:45 |
| 11010032 | Eastern Blue Cut / Blue Hole | 0 | 0 | 8 | 0 | 6:00 |
| 11010034 | Snake Pit | 0 | 0 | 6 | 0 | 4:45 |
| 11010052 | Blue Grotto (Castle Harbour) | 0 | 0 | 1 | 0 | 0:55 |
| 11010058 | Clarence Cove (Deep Bay by Spanish Point) | 0 | 0 | 4 | 0 | 2:50 |
| 11010067 | Warwick Long Bay, South Shore | 0 | 0 | 3 | 0 | 2:05 |
| 11010113 | Alexandra Battery, St Georges | 0 | 0 | 4 | 0 | 3:00 |
| 11010195 | Last Beach, Cooper's Island Road | 0 | 0 | 3 | 0 | 2:45 |
| 11012 | BREAM Sites Years 1-3 | 0 | 0 | 3 | 0 | 2:30 |
| 11012042 | BREAM 2042 Walsingham | 0 | 0 | 3 | 0 | 2:30 |
| TOTALS | 0 | 0 | 44 | 0 | 33:40 | |
Species
%SF = Sighting Frequency; DEN = Density Score - How to interpret REEF data?
Bar length corresponds to sighting frequency
Color saturation corresponds to density score
Click + to display species image and additional information.
Bar length corresponds to sighting frequency
Color saturation corresponds to density score
Click + to display species image and additional information.
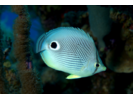
Foureye Butterflyfish - Butterflyfish
(Chaetodon capistratus)
(Chaetodon capistratus)
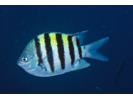
Sergeant Major - Damselfish
(Abudefduf saxatilis)
(Abudefduf saxatilis)
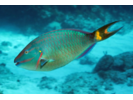
Stoplight Parrotfish - Parrotfish
(Sparisoma viride)
(Sparisoma viride)
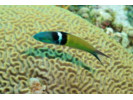
Bluehead - Wrasse
(Thalassoma bifasciatum)
(Thalassoma bifasciatum)
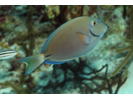
Ocean Surgeonfish - Surgeonfish
(Acanthurus tractus)
(Acanthurus tractus)
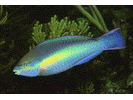
Princess Parrotfish - Parrotfish
(Scarus taeniopterus)
(Scarus taeniopterus)
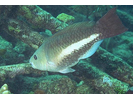
Queen Parrotfish - Parrotfish
(Scarus vetula)
(Scarus vetula)
Blue Tang - Surgeonfish
(Acanthurus coeruleus)
(Acanthurus coeruleus)
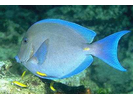
Slippery Dick - Wrasse
(Halichoeres bivittatus)
(Halichoeres bivittatus)
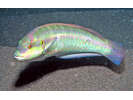
Yellowtail Damselfish - Damselfish
(Microspathodon chrysurus)
(Microspathodon chrysurus)
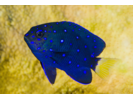
Bluestriped Grunt - Grunt
(Haemulon sciurus)
(Haemulon sciurus)
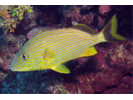
French Grunt - Grunt
(Haemulon flavolineatum)
(Haemulon flavolineatum)
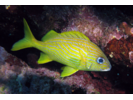
Dusky Damselfish - Damselfish
(Stegastes adustus)
(Stegastes adustus)
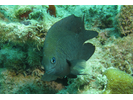
Squirrelfish - Squirrelfish
(Holocentrus adscensionis)
(Holocentrus adscensionis)

Yellowtail Snapper - Snapper
(Ocyurus chrysurus)
(Ocyurus chrysurus)
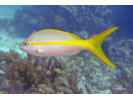
Rainbow Parrotfish - Parrotfish
(Scarus guacamaia)
(Scarus guacamaia)
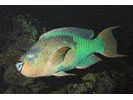
Yellowhead Wrasse - Wrasse
(Halichoeres garnoti)
(Halichoeres garnoti)
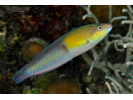
Striped Parrotfish - Parrotfish
(Scarus iseri)
(Scarus iseri)
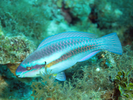
Doctorfish - Surgeonfish
(Acanthurus chirurgus)
(Acanthurus chirurgus)
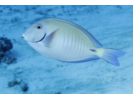
Spanish Hogfish - Wrasse
(Bodianus rufus)
(Bodianus rufus)
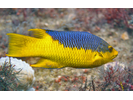
Gray Snapper - Snapper
(Lutjanus griseus)
(Lutjanus griseus)
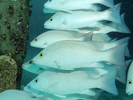
Trumpetfish - Trumpetfish
(Aulostomus maculatus)
(Aulostomus maculatus)
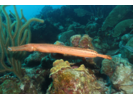
Bar Jack - Jack
(Caranx ruber)
(Caranx ruber)
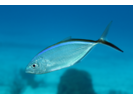
Blue Parrotfish - Parrotfish
(Scarus coeruleus)
(Scarus coeruleus)

Spotfin Butterflyfish - Butterflyfish
(Chaetodon ocellatus)
(Chaetodon ocellatus)
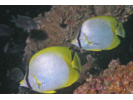
Puddingwife - Wrasse
(Halichoeres radiatus)
(Halichoeres radiatus)
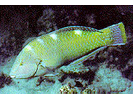
Bermuda Chub/Gray Chub - Chub
(Kyphosus sectatrix / K. bigibbus)
(Kyphosus sectatrix / K. bigibbus)
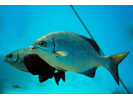
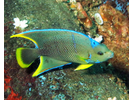
Queen Angelfish - Angelfish
(Holacanthus ciliaris)
(Holacanthus ciliaris)
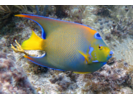
Beaugregory - Damselfish
(Stegastes leucostictus)
(Stegastes leucostictus)
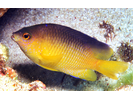
Blue Chromis - Damselfish
(Azurina cyanea)
(Azurina cyanea)
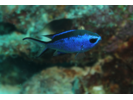
Redband Parrotfish - Parrotfish
(Sparisoma aurofrenatum)
(Sparisoma aurofrenatum)
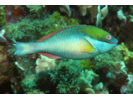
Yellowtail (Redfin) Parrotfish - Parrotfish
(Sparisoma rubripinne)
(Sparisoma rubripinne)
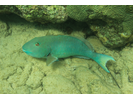
Great Barracuda - Barracuda
(Sphyraena barracuda)
(Sphyraena barracuda)
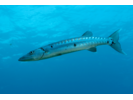
Creole Wrasse - Wrasse
(Bodianus parrae)
(Bodianus parrae)

Sand Diver - Lizardfish
(Synodus intermedius)
(Synodus intermedius)

Barred Hamlet (Caribbean) - Seabass
(Hypoplectrus puella)
(Hypoplectrus puella)
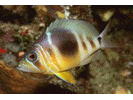
Bermuda Bream - Porgy
(Diplodus bermudensis)
(Diplodus bermudensis)
Red Hind - Seabass
(Epinephelus guttatus)
(Epinephelus guttatus)

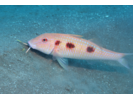
Spotted Goatfish - Goatfish
(Pseudupeneus maculatus)
(Pseudupeneus maculatus)
Redtail Parrotfish - Parrotfish
(Sparisoma chrysopterum)
(Sparisoma chrysopterum)
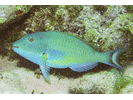
Sand Tilefish - Tilefish
(Malacanthus plumieri)
(Malacanthus plumieri)

Schoolmaster - Snapper
(Lutjanus apodus)
(Lutjanus apodus)
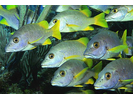
Blue Angelfish - Angelfish
(Holacanthus bermudensis)
(Holacanthus bermudensis)
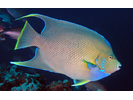
Midnight Parrotfish - Parrotfish
(Scarus coelestinus)
(Scarus coelestinus)
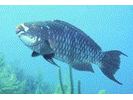
Spotted Trunkfish - Boxfish
(Lactophrys bicaudalis)
(Lactophrys bicaudalis)
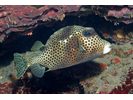
Balloonfish - Porcupinefish
(Diodon holocanthus)
(Diodon holocanthus)

Banded Butterflyfish - Butterflyfish
(Chaetodon striatus)
(Chaetodon striatus)
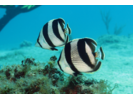
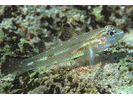
Bridled Goby Complex (Bridled/Sand-Canyon/Patch-Reef) - Goby
(C. glaucofraenum/C. venezuelae/C. tortugae)
(C. glaucofraenum/C. venezuelae/C. tortugae)
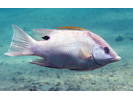
Hogfish - Wrasse
(Lachnolaimus maximus)
(Lachnolaimus maximus)
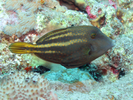
Orangespotted Filefish - Filefish
(Cantherhines pullus)
(Cantherhines pullus)
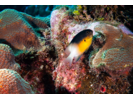
Bicolor Damselfish - Damselfish
(Stegastes partitus)
(Stegastes partitus)
Green Moray - Moray
(Gymnothorax funebris)
(Gymnothorax funebris)

Longspine Squirrelfish - Squirrelfish
(Holocentrus rufus)
(Holocentrus rufus)
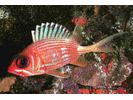
Porcupinefish - Porcupinefish
(Diodon hystrix)
(Diodon hystrix)
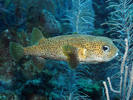
Threespot Damselfish - Damselfish
(Stegastes planifrons)
(Stegastes planifrons)
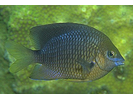
Peacock Flounder - Flounder
(Bothus lunatus)
(Bothus lunatus)
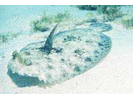
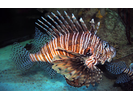
Red Lionfish (exotic) - Scorpionfish
(Pterois volitans)
(Pterois volitans)
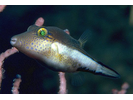
Sharpnose Puffer - Puffer
(Canthigaster rostrata)
(Canthigaster rostrata)
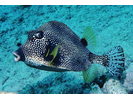
Smooth Trunkfish - Boxfish
(Lactophrys triqueter)
(Lactophrys triqueter)
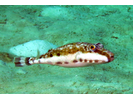
Bandtail Puffer - Puffer
(Sphoeroides spengleri)
(Sphoeroides spengleri)
Clown Wrasse - Wrasse
(Halichoeres maculipinna)
(Halichoeres maculipinna)
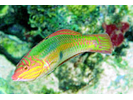
Cocoa Damselfish - Damselfish
(Stegastes xanthurus)
(Stegastes xanthurus)
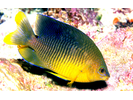
Reef Butterflyfish - Butterflyfish
(Chaetodon sedentarius)
(Chaetodon sedentarius)
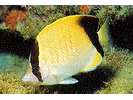
Yellow Goatfish - Goatfish
(Mulloidichthys martinicus)
(Mulloidichthys martinicus)

Black Grouper - Seabass
(Mycteroperca bonaci)
(Mycteroperca bonaci)
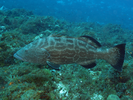
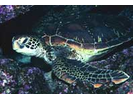
Green Sea Turtle - Sea Turtles
(Chelonia mydas)
(Chelonia mydas)
Lane Snapper - Snapper
(Lutjanus synagris)
(Lutjanus synagris)

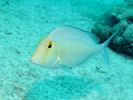
Saucereye Porgy - Porgy
(Calamus calamus)
(Calamus calamus)
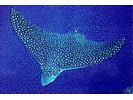
Spotted Eagle Ray - Eagle Ray
(Aetobatus narinari)
(Aetobatus narinari)
Townsend Angelfish (Hybrid Queen/Blue) - Angelfish
(Holacanthus sp. (Hybrid))
(Holacanthus sp. (Hybrid))