Dates: 7/1/19 - 7/7/19
Region: TWA
Led by: Brian Slopey
Surveyors: Catherine Hennessey, Elizabeth Wilson, Grace Murphy, Ireland Hayes, Jett Arp, Timothy Kittler, Willa Lane and Zoe Barbero Menzel
Total Surveys: 45
#Species Reported: 68
Survey Type: SA = Species & Abundance; SO = Species Only - How to interpret REEF data?
Click a column header to sort by that column. Hold shift and click to sort by multiple columns
| Surveys | Bottom Time | |||||
|---|---|---|---|---|---|---|
| Expert | Novice | |||||
| Code | Name | SA | SO | SA | SO | (H:M) |
| 1 | BERMUDA | 0 | 0 | 45 | 0 | 39:17 |
| 11 | Bermuda | 0 | 0 | 45 | 0 | 39:17 |
| 1101 | Bermuda | 0 | 0 | 45 | 0 | 39:17 |
| 11010 | Bermuda Non-BREAM Sites | 0 | 0 | 45 | 0 | 39:17 |
| 11010015 | Whalebone Bay | 0 | 0 | 5 | 0 | 5:10 |
| 11010018 | North Rock | 0 | 0 | 3 | 0 | 2:42 |
| 11010032 | Eastern Blue Cut / Blue Hole | 0 | 0 | 5 | 0 | 4:01 |
| 11010040 | Tobacco Bay to Fort St. Catherine | 0 | 0 | 4 | 0 | 3:40 |
| 11010041 | Church Bay, South Shore | 0 | 0 | 5 | 0 | 3:30 |
| 11010067 | Warwick Long Bay, South Shore | 0 | 0 | 4 | 0 | 3:30 |
| 11010077 | Point Boiler Reefs, Cooper's Island | 0 | 0 | 1 | 0 | 1:20 |
| 11010114 | Eastern Blue Cut at Beacon | 0 | 0 | 1 | 0 | 0:40 |
| 11010128 | Spanish Point | 0 | 0 | 9 | 0 | 7:40 |
| 11010171 | Arches, St Davids Island | 0 | 0 | 4 | 0 | 3:24 |
| 11010190 | BIOS Terrace Reef | 0 | 0 | 1 | 0 | 0:45 |
| 11010195 | Last Beach, Cooper's Island Road | 0 | 0 | 3 | 0 | 2:55 |
| TOTALS | 0 | 0 | 45 | 0 | 39:17 | |
Species
%SF = Sighting Frequency; DEN = Density Score - How to interpret REEF data?
Bar length corresponds to sighting frequency
Color saturation corresponds to density score
Click + to display species image and additional information.
Bar length corresponds to sighting frequency
Color saturation corresponds to density score
Click + to display species image and additional information.
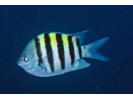
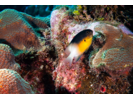
Sergeant Major - Damselfish
(Abudefduf saxatilis)
(Abudefduf saxatilis)
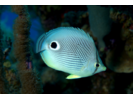
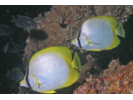
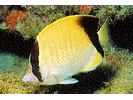
Foureye Butterflyfish - Butterflyfish
(Chaetodon capistratus)
(Chaetodon capistratus)
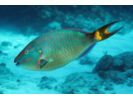
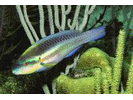
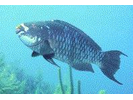
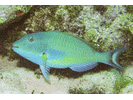
Stoplight Parrotfish - Parrotfish
(Sparisoma viride)
(Sparisoma viride)
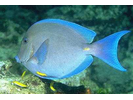
Blue Tang - Surgeonfish
(Acanthurus coeruleus)
(Acanthurus coeruleus)
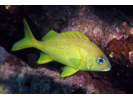
French Grunt - Grunt
(Haemulon flavolineatum)
(Haemulon flavolineatum)
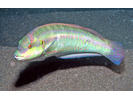
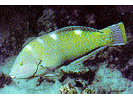
Slippery Dick - Wrasse
(Halichoeres bivittatus)
(Halichoeres bivittatus)
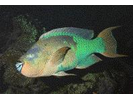
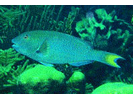
Rainbow Parrotfish - Parrotfish
(Scarus guacamaia)
(Scarus guacamaia)
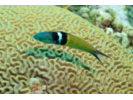
Bluehead - Wrasse
(Thalassoma bifasciatum)
(Thalassoma bifasciatum)
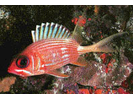
Squirrelfish - Squirrelfish
(Holocentrus adscensionis)
(Holocentrus adscensionis)

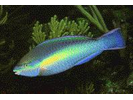
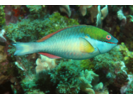
Princess Parrotfish - Parrotfish
(Scarus taeniopterus)
(Scarus taeniopterus)
Queen Parrotfish - Parrotfish
(Scarus vetula)
(Scarus vetula)
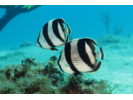
Banded Butterflyfish - Butterflyfish
(Chaetodon striatus)
(Chaetodon striatus)
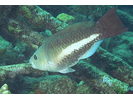
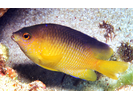
Beaugregory - Damselfish
(Stegastes leucostictus)
(Stegastes leucostictus)
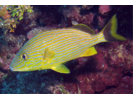
Bluestriped Grunt - Grunt
(Haemulon sciurus)
(Haemulon sciurus)
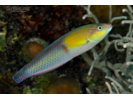
Yellowhead Wrasse - Wrasse
(Halichoeres garnoti)
(Halichoeres garnoti)
Blue Parrotfish - Parrotfish
(Scarus coeruleus)
(Scarus coeruleus)

Doctorfish - Surgeonfish
(Acanthurus chirurgus)
(Acanthurus chirurgus)
Spotfin Butterflyfish - Butterflyfish
(Chaetodon ocellatus)
(Chaetodon ocellatus)
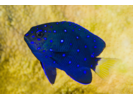
Yellowtail Damselfish - Damselfish
(Microspathodon chrysurus)
(Microspathodon chrysurus)
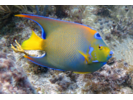
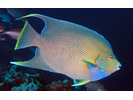
Queen Angelfish - Angelfish
(Holacanthus ciliaris)
(Holacanthus ciliaris)
Bermuda Chub/Gray Chub - Chub
(Kyphosus sectatrix / K. bigibbus)
(Kyphosus sectatrix / K. bigibbus)
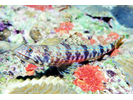
Sand Diver - Lizardfish
(Synodus intermedius)
(Synodus intermedius)
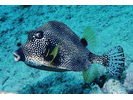
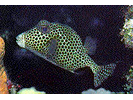
Smooth Trunkfish - Boxfish
(Lactophrys triqueter)
(Lactophrys triqueter)
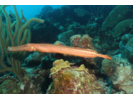
Trumpetfish - Trumpetfish
(Aulostomus maculatus)
(Aulostomus maculatus)
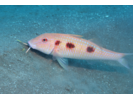
Spotted Goatfish - Goatfish
(Pseudupeneus maculatus)
(Pseudupeneus maculatus)
Striped Parrotfish - Parrotfish
(Scarus iseri)
(Scarus iseri)
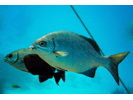
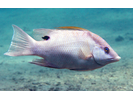
Bermuda Bream - Porgy
(Diplodus bermudensis)
(Diplodus bermudensis)
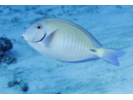
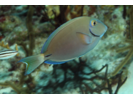
Ocean Surgeonfish - Surgeonfish
(Acanthurus tractus)
(Acanthurus tractus)
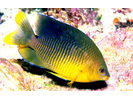
Spanish Hogfish - Wrasse
(Bodianus rufus)
(Bodianus rufus)
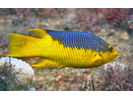
Blue Angelfish - Angelfish
(Holacanthus bermudensis)
(Holacanthus bermudensis)
Puddingwife - Wrasse
(Halichoeres radiatus)
(Halichoeres radiatus)
Redband Parrotfish - Parrotfish
(Sparisoma aurofrenatum)
(Sparisoma aurofrenatum)
Spotted Trunkfish - Boxfish
(Lactophrys bicaudalis)
(Lactophrys bicaudalis)
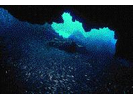
Unidentified Silvery Fish (Silversides / Anchovies / Herrings) - Silvery Fishes - Silversides, Herrings, and Anchovies
(Atheriniformes sp./ Clupeiformes sp.)
(Atheriniformes sp./ Clupeiformes sp.)
Longspine Squirrelfish - Squirrelfish
(Holocentrus rufus)
(Holocentrus rufus)
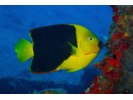
Rock Beauty - Angelfish
(Holacanthus tricolor)
(Holacanthus tricolor)
Bar Jack - Jack
(Caranx ruber)
(Caranx ruber)
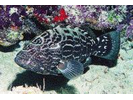
Black Grouper - Seabass
(Mycteroperca bonaci)
(Mycteroperca bonaci)
Midnight Parrotfish - Parrotfish
(Scarus coelestinus)
(Scarus coelestinus)
Yellowtail (Redfin) Parrotfish - Parrotfish
(Sparisoma rubripinne)
(Sparisoma rubripinne)
Cocoa Damselfish - Damselfish
(Stegastes xanthurus)
(Stegastes xanthurus)
Gray Snapper - Snapper
(Lutjanus griseus)
(Lutjanus griseus)
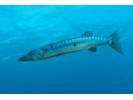
Great Barracuda - Barracuda
(Sphyraena barracuda)
(Sphyraena barracuda)
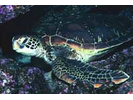
Green Sea Turtle - Sea Turtles
(Chelonia mydas)
(Chelonia mydas)
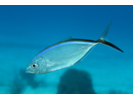
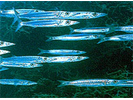
Northern / Southern Sennet - Barracuda
(Sphyraena borealis/picudilla)
(Sphyraena borealis/picudilla)
Redtail Parrotfish - Parrotfish
(Sparisoma chrysopterum)
(Sparisoma chrysopterum)
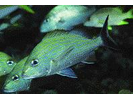
Schoolmaster - Snapper
(Lutjanus apodus)
(Lutjanus apodus)
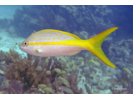
Yellow Goatfish - Goatfish
(Mulloidichthys martinicus)
(Mulloidichthys martinicus)

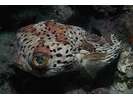
Balloonfish - Porcupinefish
(Diodon holocanthus)
(Diodon holocanthus)
Black Durgon - Triggerfish
(Melichthys niger)
(Melichthys niger)

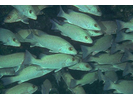
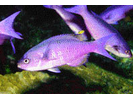
Creole Wrasse - Wrasse
(Clepticus parrae)
(Clepticus parrae)
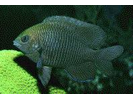
Dusky Damselfish - Damselfish
(Stegastes adustus)
(Stegastes adustus)
Hogfish - Wrasse
(Lachnolaimus maximus)
(Lachnolaimus maximus)
Peacock Flounder - Flounder
(Bothus lunatus)
(Bothus lunatus)
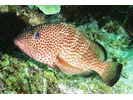
Red Hind - Seabass
(Epinephelus guttatus)
(Epinephelus guttatus)
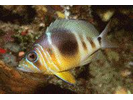
Barred Hamlet (Caribbean) - Seabass
(Hypoplectrus puella)
(Hypoplectrus puella)
Bicolor Damselfish - Damselfish
(Stegastes partitus)
(Stegastes partitus)
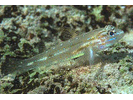
Bridled Goby Complex (Bridled/Sand-Canyon/Patch-Reef) - Goby
(C. glaucofraenum/C. bol/C. tortugae)
(C. glaucofraenum/C. bol/C. tortugae)
Caesar Grunt - Grunt
(Haemulon carbonarium)
(Haemulon carbonarium)
Eyed Flounder - Flounder
(Bothus ocellatus)
(Bothus ocellatus)
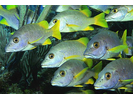
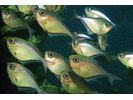
Glassy Sweeper - Sweeper
(Pempheris schomburgkii)
(Pempheris schomburgkii)
Honeycomb Cowfish - Boxfish
(Acanthostracion polygonius)
(Acanthostracion polygonius)

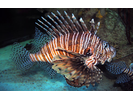
Red Lionfish (exotic) - Scorpionfish
(Pterois volitans)
(Pterois volitans)
Reef Butterflyfish - Butterflyfish
(Chaetodon sedentarius)
(Chaetodon sedentarius)
Sea Turtle sp. (unidentified) - Sea Turtles
()
()
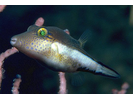
Sharpnose Puffer - Puffer
(Canthigaster rostrata)
(Canthigaster rostrata)
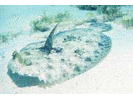
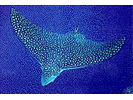
Spotted Eagle Ray - Eagle Ray
(Aetobatus narinari)
(Aetobatus narinari)
Yellowtail Snapper - Snapper
(Ocyurus chrysurus)
(Ocyurus chrysurus)